The 40_transport module simulates the intraregional transportation of agricultural products between producer site and the next city centre (market). It covers the transport of inputs such as fertilizers to the production site as well as the transport of products to the market. Calculations are based on cellular and global parameters and returns the corresponding cellular transport costs which are then used by the 11_costs module.
| Description | Unit | A | B | |
|---|---|---|---|---|
| vm_prod (j, k) |
Production in each cell | \(10^6 tDM/yr\) | x |
| Description | Unit | |
|---|---|---|
| vm_cost_transp (j, k) |
Transportation costs | \(10^6 USD_{05MER}/yr\) |
In this realization transportation costs are calculated based on the assumption that transport costs are proportional to the mass which has to be transported and the time which is required for the transport.
\[\begin{multline*} vm\_cost\_transp(j2,k) = vm\_prod(j2,k) \cdot f40\_distance(j2) \cdot f40\_transport\_costs(k) \end{multline*}\]
Transportation costs for each cell are calculated as the product of the production in each cell, the transport distance to a urban centre and the transport costs.
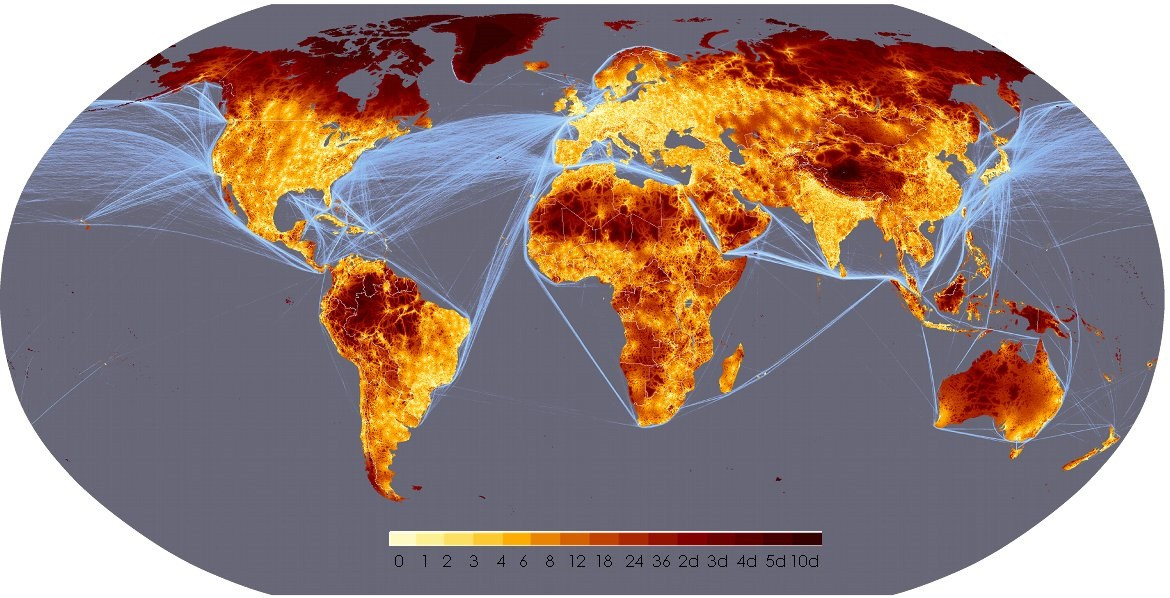
As cellular distance information f40_distance(j2), the European Commission Joint Research Centre (EC JRC)’s 30 arc-second resolution map on travel time for any location on the earth surface to the nearest large city is used (figure below - Nelson (2008)). The data set is based on multiple indicators (biophysical, administrative and transport mode) which determine the friction surface that in turn determines the time needed to transport goods across grid cells. The cumulated time needed to reach an urban center of minimal 50000 inhabitants stands as static proxy for accessibility of a grid cell.
Relative transport costs f40_transport_costs(k) are calibrated using total agricultural transport costs taken from the GTAP 7 database (see Narayanan and Walmsley (2008) for a general description of the GTAP model structure). GTAP agricultural transport costs represent transport costs from one sector to another sector (e.g. from a farm to the mill). Based on GTAP we calculate sector to sector transport costs for agricultural inputs and outputs. In MAgPIE we want to represent market to market transport costs. Since markets are the links between sectors, we assume that the sum of 50% of the agricultural input transport costs and 50% of the output transport costs represent the agricultural transport costs for a commodity.
Relative transport costs f40_transport_costs(k) are calculated by dividing total agricultural transport costs from GTAP 7 by the product of an initial (1995 as default) cellular MAgPIE production pattern and cellular travel time. By doing so we ensure that relative transport costs, multiplied with the initial MAgPIE production allocation and given travel times match the absolute transport costs as reported by GTAP 7.
Total agricultural transport costs from GTAP 7 are based on total agricultural production in 2004. For consistency, we scale the GTAP data with the ratio of FAO production data for 2004 and 1995. Subsequently, MAgPIE is run several times in yield calibration mode until regional MAgPIE production is consistent with FAO production for the initial time step. Based on this first calibration run, total MAgPIE transportation costs are summed up and compared with GTAP data (see Figure 3). In case of low agreement, the calculation of relative transportation costs is repeated based on the calibrated MAgPIE production pattern and a second round of MAgPIE yield calibration is started. This process is repeated until MAgPIE total transport costs are in good agreement with GTAP total transport costs.
Limitations The information in distances between production sites and markets is static over time, meaning that infrastructure is assumed to be static over time.
In this realization the transport of goods is assumed to be free of charge. Correspondingly transportation costs are fixed to 0.
Limitations No simulation of transportation (transportation free of charge).
| Description | Unit | A | B | |
|---|---|---|---|---|
| f40_distance (j) |
Transport distance to urban center | \(min\) | x | |
| f40_transport_costs (kall) |
Relative transport costs | \(USD_{05MER}/tDM/min\) | x | |
| q40_cost_transport (j, k) |
Cellular transport costs for k | \(10^6 USD_{05MER}/yr\) | x | |
| s40_pasture_transport_costs | Transport costs for pasture | \(USD_{05MER}/tDM/min\) | x |
| description | |
|---|---|
| j | number of LPJ cells |
| j2(j) | Spatial Clusters (dynamic set) |
| k(kall) | Primary products |
| kall | All products in the sectoral version |
| t(t_all) | Simulated time periods |
| type | GAMS variable attribute used for the output |
Jan Philipp Dietrich, Florian Humpenöder, Benjamin Bodirsky, Isabelle Weindl, Michael Krause.
Narayanan, G. Badri, and Eds. Walmsley Terrie L. 2008. Global Trade, Assistance, and Production: The Gtap 7 Data Base. Center for Global Trade Analysis, Purdue University. http://www.gtap.agecon.purdue.edu/databases/v7/v7_doco.asp.
Nelson, A. 2008. “Travel Time to Major Cities: A Global Map of Accessibility.” Luxembourg: Office for Official Publications of the European Communities. https://doi.org/10.2788/95835.