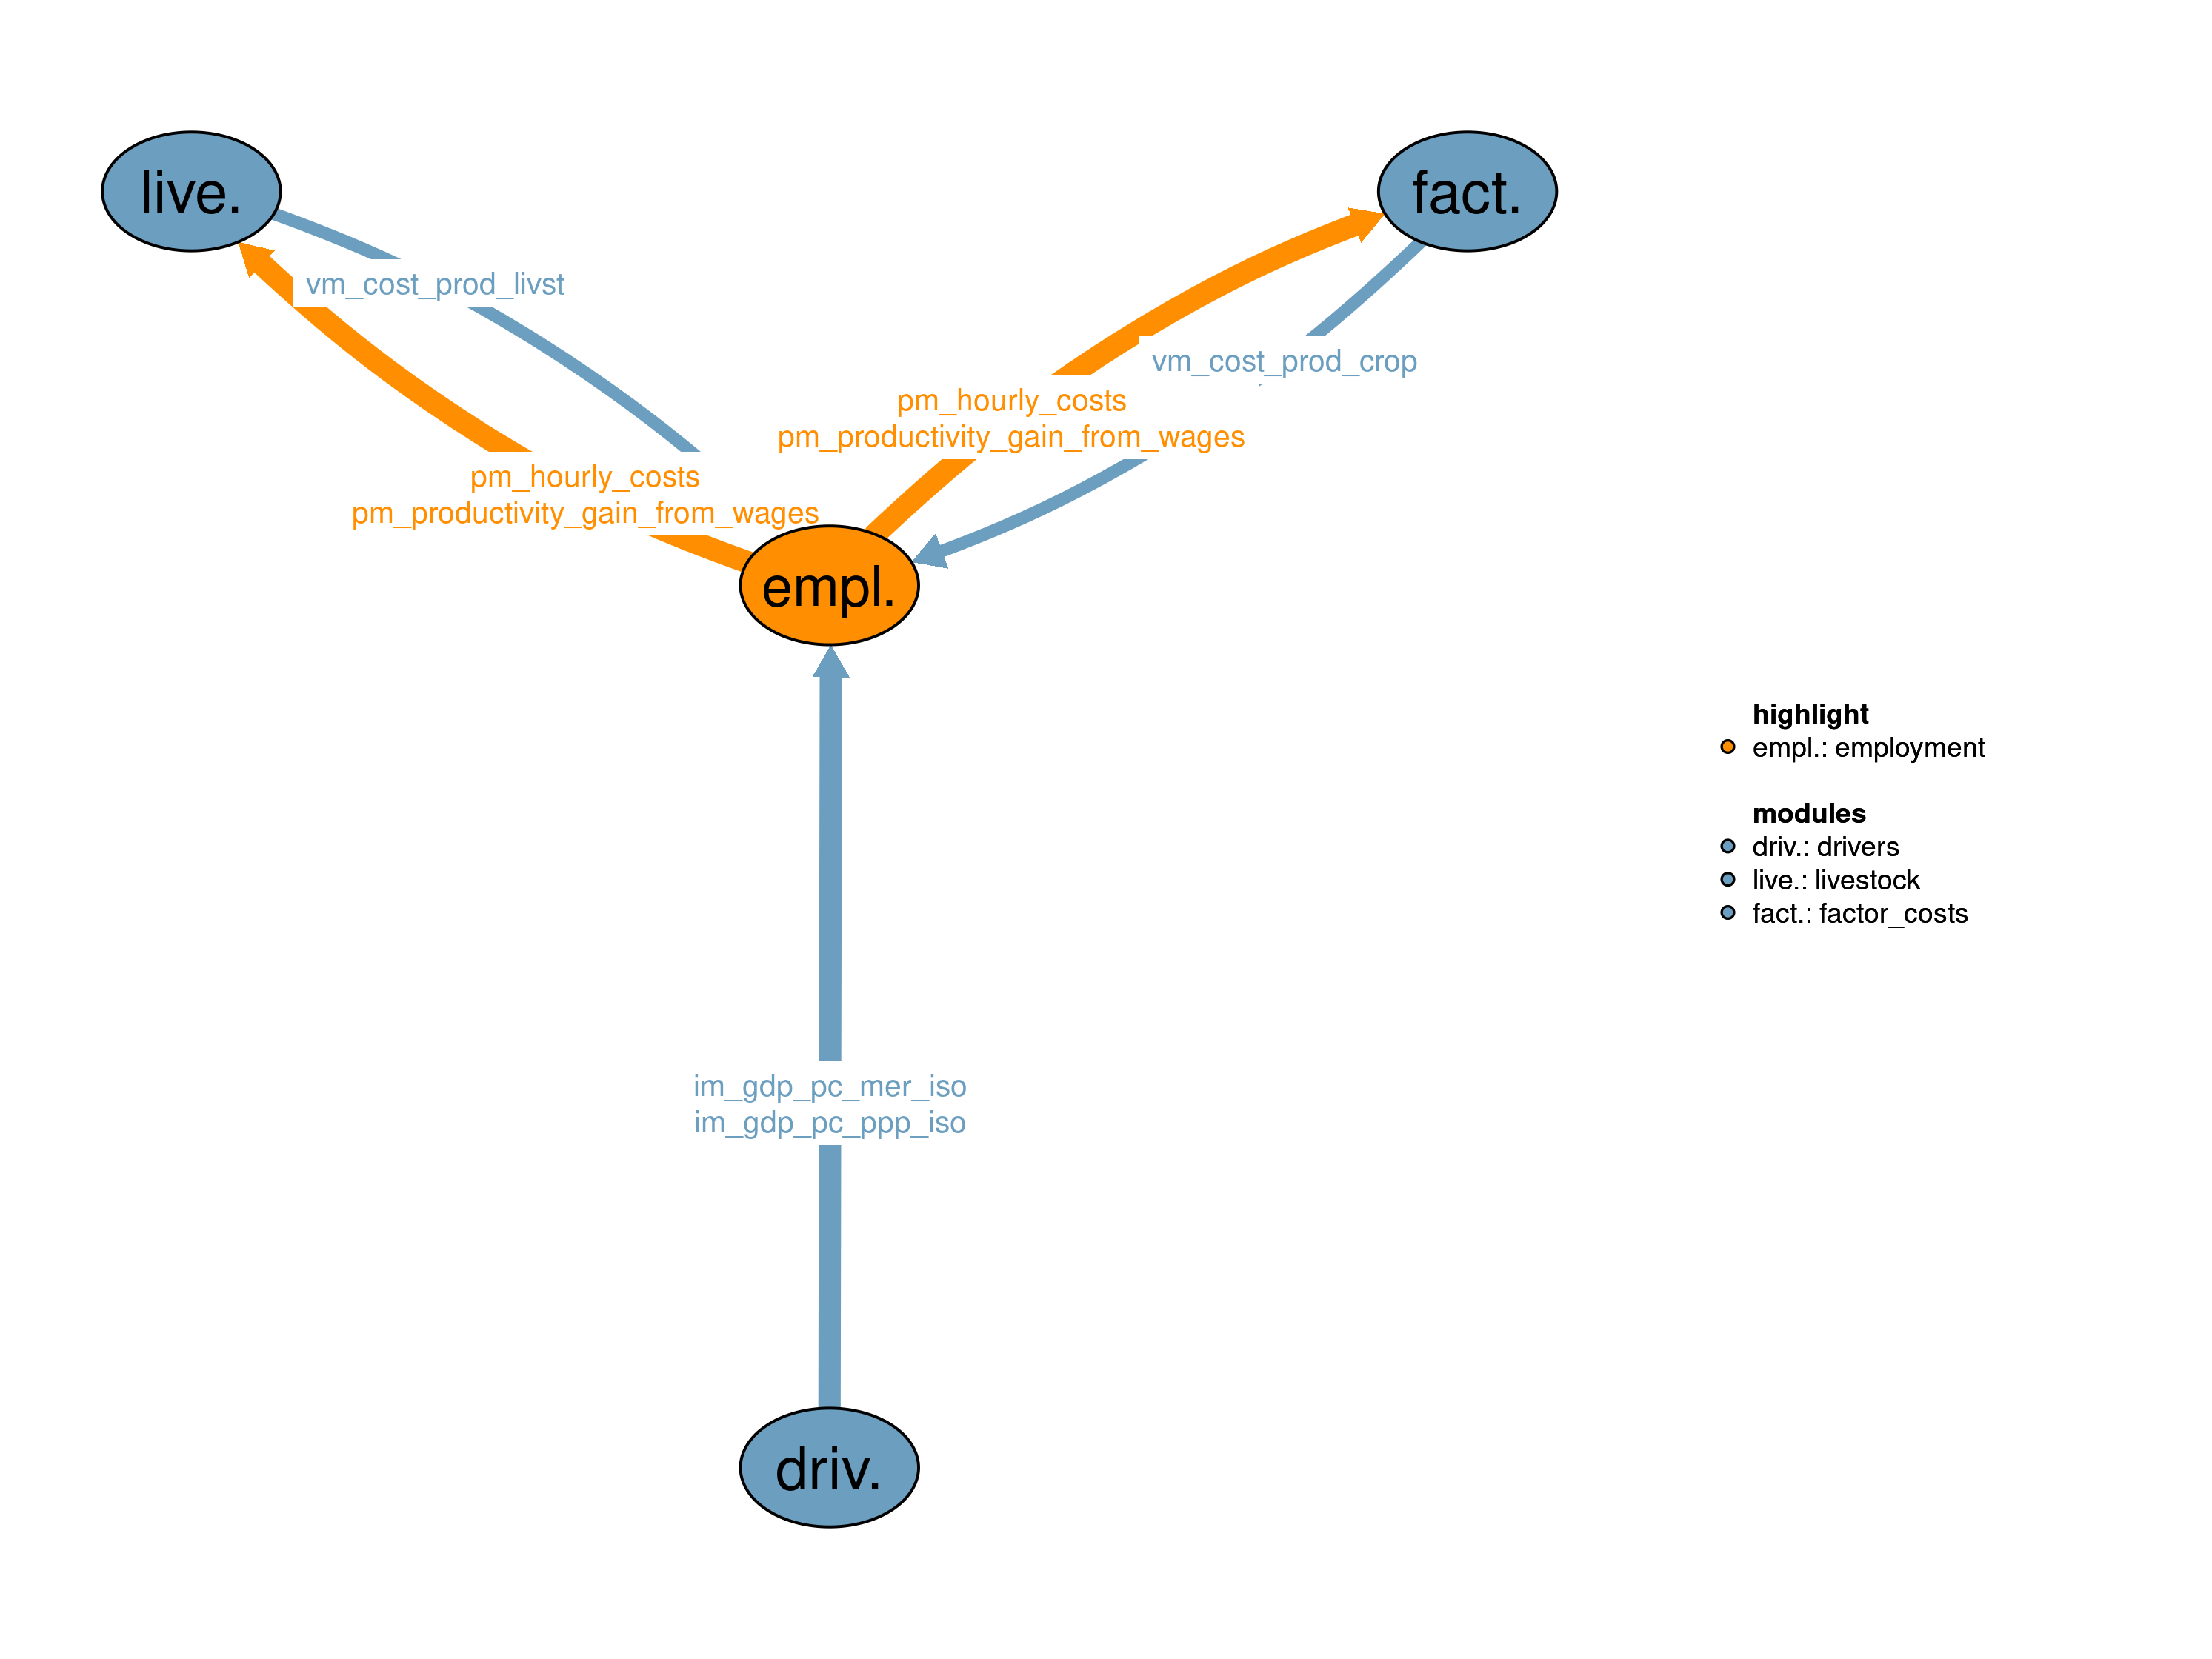
This module is used to calculate hourly labor costs in agriculutre and the number of people employed in crop and livestock production. Hourly labor costs are calculated based on a regression with GDP pc from 09_drivers. They can be increased by an externally set global minimum wage. Wages as well as productivity gain from higher wages are provided to 38_factor_costs and 70_livestock, to scale total labor costs accordingly. The calculation of employment then uses labor costs for crop and livestock production coming from 38_factor_costs and 70_livestock.
| Description | Unit | A | |
|---|---|---|---|
| im_gdp_pc_mer_iso (t_all, iso) |
Income in market exchange rates | \(10^6 USD_{05MER}/yr\) | x |
| im_gdp_pc_ppp_iso (t_all, iso) |
Per capita income in purchasing power parity | \(USD_{05PPP}/cap/yr\) | x |
| vm_cost_prod_crop (i, req) |
Regional factor costs of capital and labor for crop production | \(10^6 USD_{05MER}/yr\) | x |
| vm_cost_prod_livst (i, req) |
Livestock factor costs | \(10^6 USD_{05MER}/yr\) | x |
| Description | Unit | |
|---|---|---|
| pm_hourly_costs (t, i, wage_scen) |
Hourly labor costs in agriculture on regional level before and after including wage scenario | \(USD_{MER}05/hour\) |
| pm_productivity_gain_from_wages (t, i) |
Multiplicative factor describing productivity gain related to higher wages | \(1\) |
This realization calculates agricultural employment based on it’s relation to total labor costs. It therefore depends on the labor costs calculated in the modules 38_factor_costs and 70_livestock. Resulting total costs and production patterns can be affected if an external wage scenario is used, which increases labor costs for crop and livestock production in 38_factor_costs and 70_livestock.
Employment is calculated as total labor costs divided by hourly labor costs and average hours worked per employed person per year. Total labor costs include labor costs from crop production (see 38_factor_costs) and livestock production (see 70_livestock), and some labor costs for crop and livestock production which are not covered by MAgPIE.
\[\begin{multline*} v36\_employment(i2) = \left(vm\_cost\_prod\_crop(i2,"labor") + vm\_cost\_prod\_livst(i2,"labor") + \sum_{ct}p36\_nonmagpie\_labor\_costs(ct,i2)\right) \cdot \left(\frac{1 }{ \sum_{ct}\left(f36\_weekly\_hours(ct,i2) \cdot s36\_weeks\_in\_year \cdot pm\_hourly\_costs(ct,i2,"scenario")\right)}\right) \end{multline*}\]
Hourly labor costs are projected into the future by using a linear regression with GDPpcMER, which is calibrated such that historic values of agricultural employment are met. A threshold is used in the regression to avoid too low or negative hourly labor costs.
p36_hourly_costs_iso(t_all,iso,"baseline") = max((im_gdp_pc_mer_iso(t_all,iso) * f36_regr_hourly_costs("slope") +
                                                  f36_regr_hourly_costs("intercept") + p36_calibration_hourly_costs(iso)),
                                                 f36_regr_hourly_costs("threshold"));
In case of a scenario with an external global minimum wage we add a linear term to the baseline hourly labor costs, starting from 0 zero in 2020 and increasing such that resulting hourly labor costs will match the minimum wage in 2050. After 2050 the additional term is decreased again, reaching 0 in 2100 (where baseline hourly labor costs and new hourly labor costs will match again). In case this means that hourly labor costs would decrease again below the minimum wage after 2050, we keep them at minimum wage. If baseline hourly labor costs are already high enough to meet the minimum wage in 2050, they are not changed.
A scenario that increases wages can either be fully related to productivity increase (leading to lower employment for the same total labor costs), or keep productivity constant (leading to the same employment for higher total labor costs), or show a mixture between productivity increase and total labor cost increase. The scalar s36_scale_productivity_with_wage describes how high the labor productivity gain should be relative to the increase in hourly labor costs and is used to calculate pm_productivity_gain_from_wages, which is applied to labor costs for crop production (38_factor_costs), livestock production (70_livestock), and the non-MAgPIE labor costs. If s36_scale_productivity_with_wage = 1 the productivity gain and wage increase cancel out, leading to the same total labor costs as without wage scenario. For s36_scale_productivity_with_wage = 0 the total labor costs scale proportional to the hourly labor costs. For other values, the total labor costs show a non-linear realtionship with s36_scale_productivity_with_wage.
pm_productivity_gain_from_wages(t,i) = s36_scale_productivity_with_wage * (pm_hourly_costs(t,i,"scenario") / pm_hourly_costs(t,i,"baseline")) + (1 - s36_scale_productivity_with_wage);Non-MAgPIE labor costs consist of the labor cost share of subsidies and from livestock categories not covered by MAgPIE (i.e. wool, beeswax, honey, silk-worms), which are both kept constant for future years.
p36_nonmagpie_labor_costs(t,i) = (f36_unspecified_subsidies(t,i) + f36_nonmagpie_factor_costs(t,i)) * (1-p36_cost_share(t,i)) * (1/pm_productivity_gain_from_wages(t,i)) * (pm_hourly_costs(t,i,"scenario") / pm_hourly_costs(t,i,"baseline"));Limitations Labor availability is not seen as a limiting factor for agricultural production, as the number of people employed is directly linked to labor costs which scale with the amount of production. Furthermore, hourly labor costs are projected into the future based on a regression with GDP pc, while factor requirements for crops (i.e. labor + capital costs per production unit) are kept constant. This means, that the increase in the baseline wages over time is assumed to be matched by a corresponding increase in labor productivity. For external wage scenarios that lead to higher wages the additional wage increase can be either related to productivity increase or higher total labor costs.
| Description | Unit | A | |
|---|---|---|---|
| f36_hist_cap_share (t_all, i) |
Historical capital share | x | |
| f36_hist_hourly_costs (t_all, iso) |
Historical values of hourly labor costs in agriculture | \(USD_{05MER}/h\) | x |
| f36_historic_ag_empl (t_all, iso) |
Historical values of people employed in agruculture | \(10^6 people\) | x |
| f36_nonmagpie_factor_costs (t_all, i) |
Factor cost share of VoP from ag commodities not mapped to MAgPIE | \(10^6 USD_{05MER}\) | x |
| f36_regr_cap_share (reg36) |
Parameters for dynamic regression | x | |
| f36_regr_hourly_costs (reg36) |
Parameters for regression of hourly labor costs with GDPpcMER | x | |
| f36_unspecified_subsidies (t_all, i) |
Factor cost share of unspecified subsidies not included in MAgPIE labor costs | \(10^6 USD_{05MER}\) | x |
| f36_weekly_hours (t_all, i) |
Historical values of average weekly hours worked per person in agriculture | \(h/week\) | x |
| f36_weekly_hours_iso (t_all, iso) |
Historical values of average weekly hours worked per person in agriculture on iso level | \(h/week\) | x |
| p36_calibration_hourly_costs (iso) |
Additive calibration term for hourly labor costs | \(USD_{MER}05/hour\) | x |
| p36_cost_share (t, i) |
Capital share of factor costs | \(1\) | x |
| p36_hourly_costs_increase (iso) |
Difference between minimum hourly labor costs and actual hourly labor costs in 2050 | \(USD_{MER}05/hour\) | x |
| p36_hourly_costs_iso (t_all, iso, wage_scen) |
Hourly labor costs in agriculture on iso level before and after including wage scenario | \(USD_{MER}05/hour\) | x |
| p36_nonmagpie_labor_costs (t, i) |
Labor costs from subsidies and Value of Production not covered by MAgPIE | \(10^6 USD_{MER}05\) | x |
| p36_share_calibration (i) |
Additive calibration term for capital shares | \(1\) | x |
| p36_total_hours_worked (iso) |
Total hours worked by all employed people | \(10^6 hours/year\) | x |
| q36_employment (i) |
Regional agricultural emplyoment | \(10^6 people\) | x |
| s36_minimum_wage | global minimum wage | \(USD_{MER}05/hour\) | x |
| s36_scale_productivity_with_wage | how strong the wage increase should affect labor productivity | \(1\) | x |
| s36_weeks_in_year | number of weeks in a year | \(weeks/yr\) | x |
| v36_employment (i) |
Number of people employed in agriculture | \(10^6 people\) | x |
| description | |
|---|---|
| ct(t) | Current time period |
| h | all superregional economic regions |
| i | all economic regions |
| i_to_iso(i, iso) | mapping regions to iso countries |
| i2(i) | World regions (dynamic set) |
| iso | list of iso countries |
| reg36 | regression coefficients |
| req | input requirements |
| t_all(t_ext) | 5-year time periods |
| t_past(t_all) | Timesteps with observed data |
| t(t_all) | Simulated time periods |
| type | GAMS variable attribute used for the output |
| wage_scen | version of wages |
Debbora Leip
09_drivers, 38_factor_costs, 70_livestock