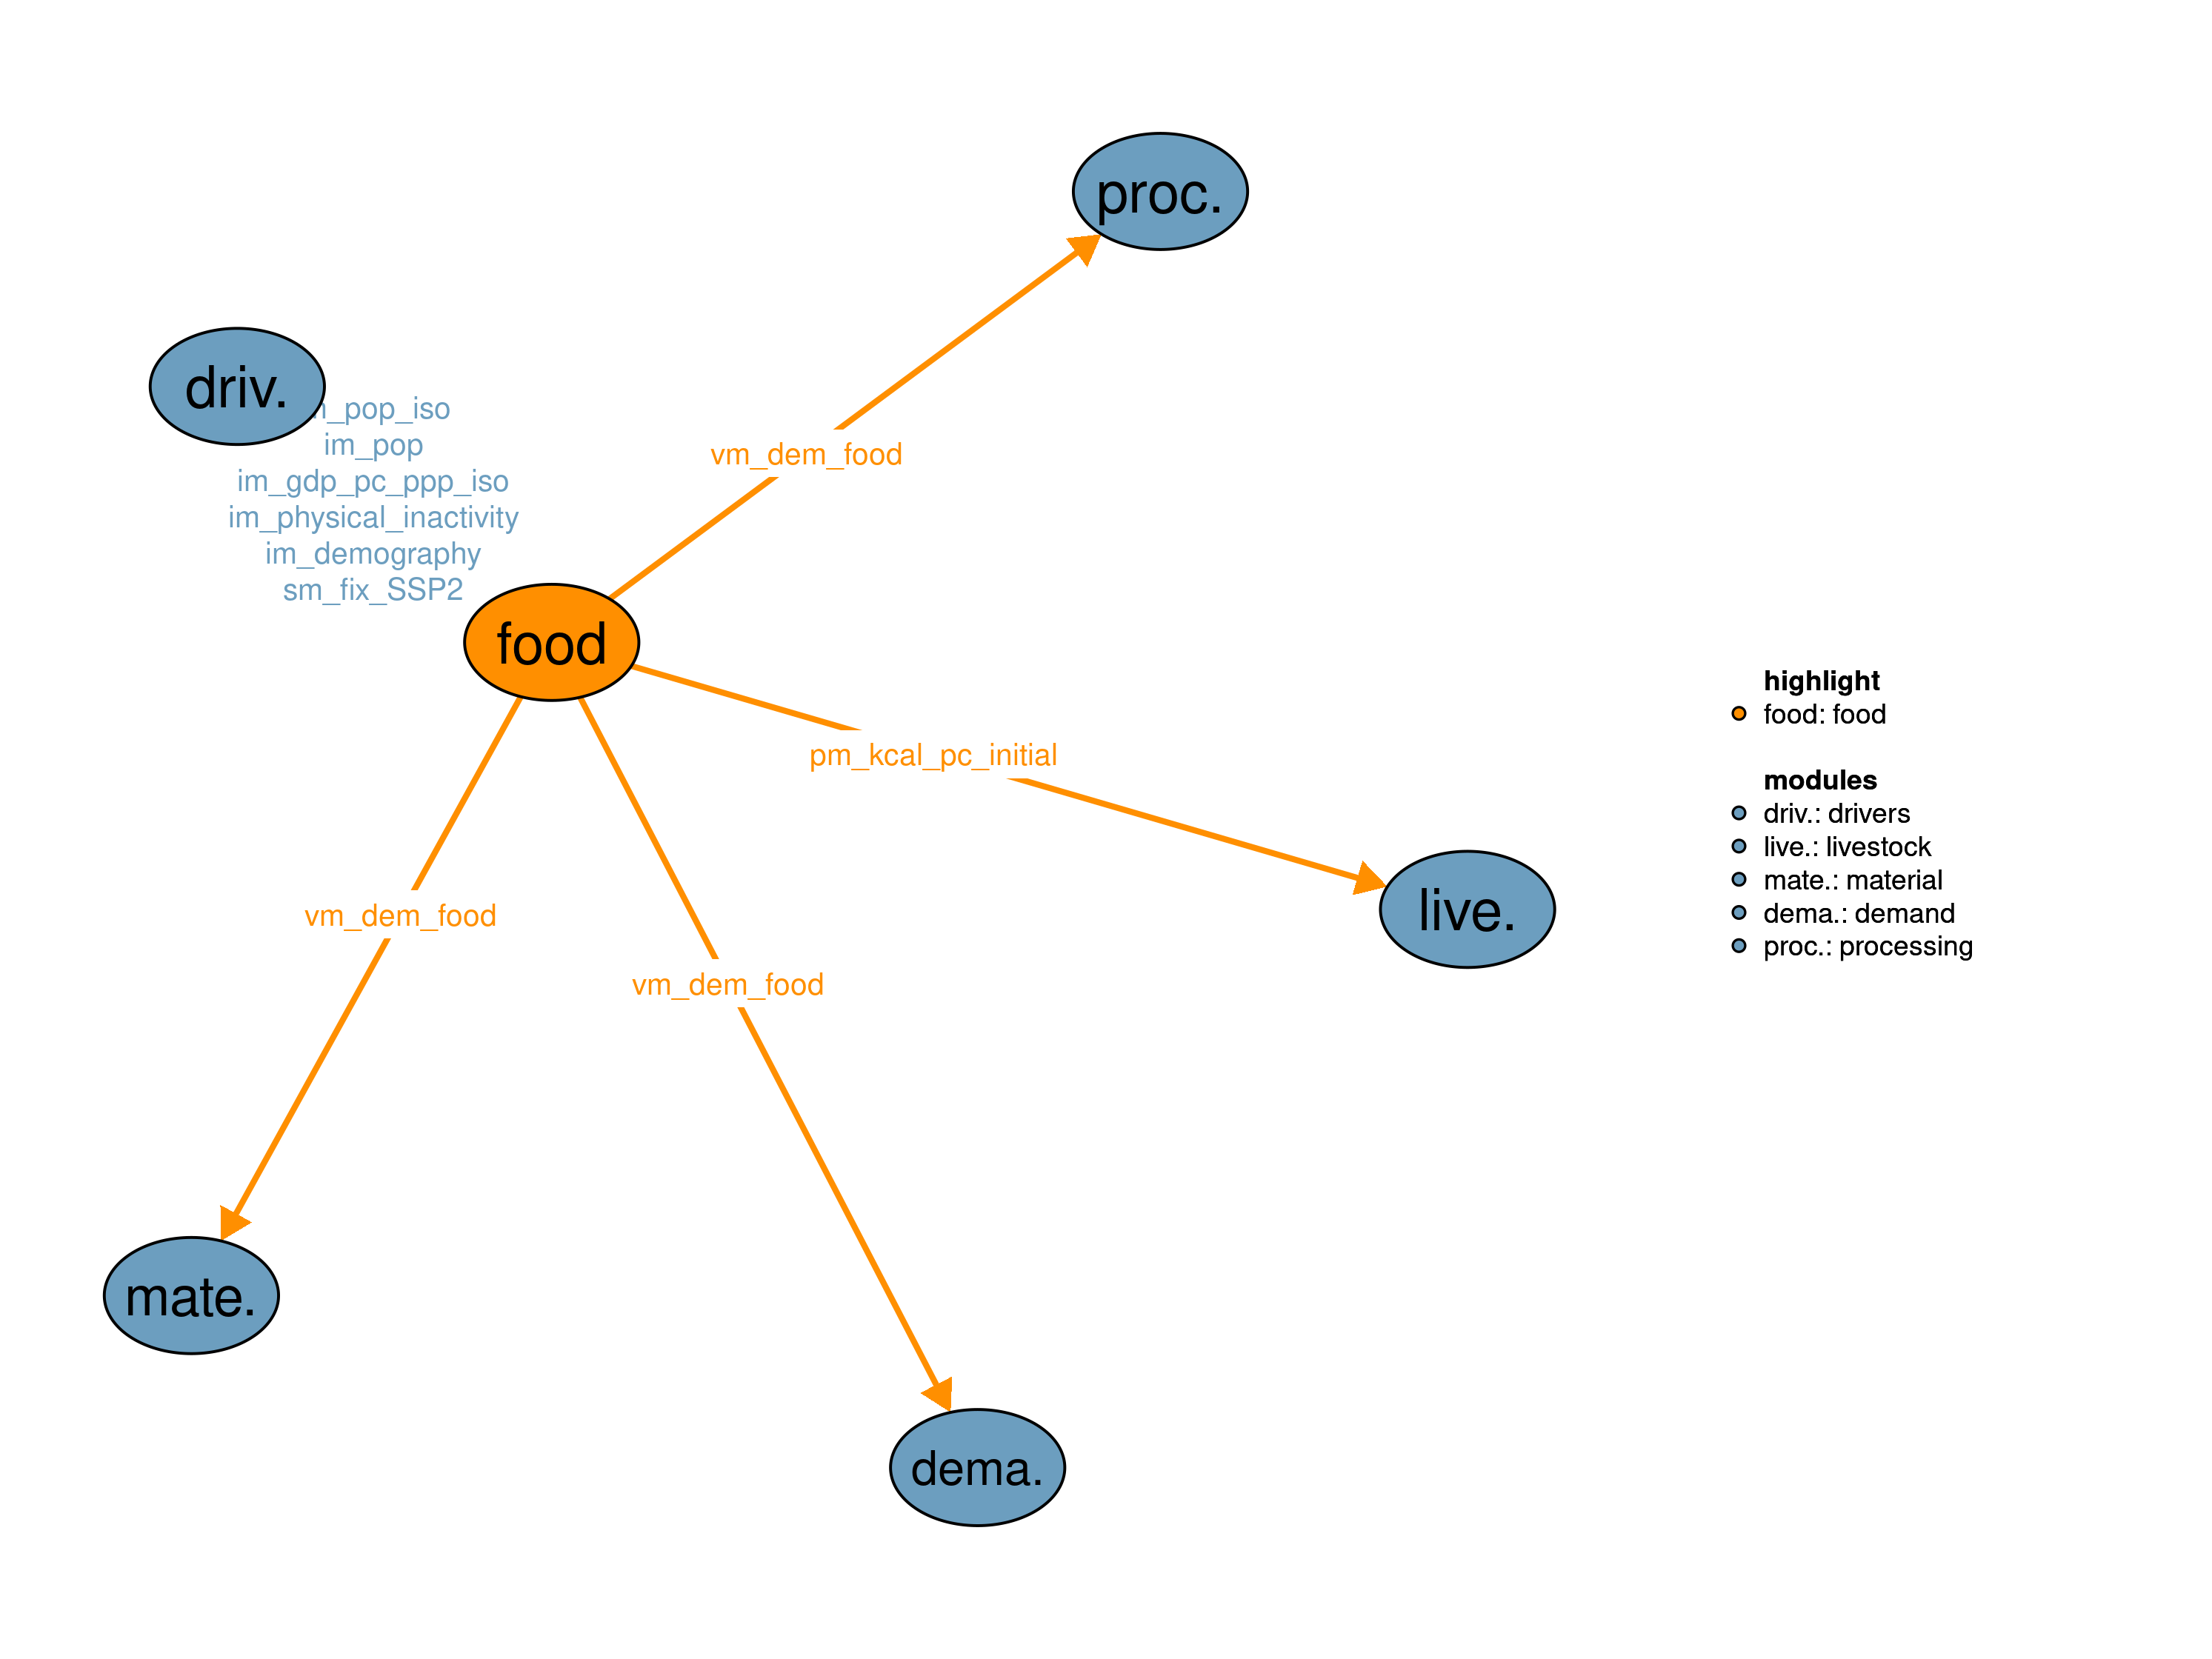
The food demand module forecasts the food demand vm_dem_food for various agricultural products, which is used in the module 16_demand. Drivers of food demand are population, income, and demographic structure from module 09_drivers, as well as module-specific scenario assumptions. In the case of elastic demand, the model uses the shadow price of agricultural commodities q15_food_demand.m to change food demand and iterates with MAgPIE until a common solution is found. Outputs include next to food demand also projections of anthropometric parameters such as body height and weight distribution, as well as phyiscal activity levels.
| Description | Unit | A | B | |
|---|---|---|---|---|
| im_demography (t_all, iso, sex, age) |
Population by groups | \(10^6/yr\) | x | x |
| im_gdp_pc_ppp_iso (t_all, iso) |
Per capita income in purchasing power parity | \(USD_{05PPP}/cap/yr\) | x | x |
| im_physical_inactivity (t_all, iso, sex, age) |
Share of population which is physically inactive | \(1\) | x | x |
| im_pop (t_all, i) |
Population | \(10^6/yr\) | x | x |
| im_pop_iso (t_all, iso) |
Population | \(10^6/yr\) | x | x |
| sm_fix_SSP2 | year until which all parameters are fixed to SSP2 values | \(year\) | x | x |
| sm_intersolve | if 0 finish loop or if 1 iterate optimization | \(1\) | x | x |
| Description | Unit | |
|---|---|---|
| pm_kcal_pc_initial (t, i, kfo) |
Per capita consumption in food demand model before price shock | \(kcal/capita/day\) |
| vm_dem_food (i, kall) |
Food demand | \(10^6 tDM/yr\) |
This realization uses per capita income and the demography of the world population (including sex and age classes at the country level, which are provided from module 09_drivers) as drivers. The module estimates food demand on iso-country level taking anthropometric food requirements as well as economic dynamics into account. If flexible demand is activated, the module also uses the shadow prices for agircultural products from the optimization, which are the Lagrange multipliers of the constraint q15_food_demand. The module consists of a standalone food demand model, which is executed before MAgPIE starts. In the case of endogenous demand, the module is iterated with MAgPIE. Besides providing the fooduse of agricultural products, the model also provides a number of output indicators, including the BMI distribution, body weight and height of the population by age and sex, food intake by age group and sex, food waste, dietary composition between livestock products, empty calories (sugar, oil and alcohol), fruits vegetables and nuts, as well as staple calories. The food demand model can be run in standalone mode by running the the file standalone/demand_model.gms. The model is described in (Bodirsky et al. 2020).

The model also includes a number of switches that allow for exogenous diet scenarios, most importantly the shift to the Planetary Health diet (Willett et al. 2019).
The food demand model consists of the following equations, which are not part of MAgPIE.
model m15_food_demand /
      q15_aim,
      q15_budget,
      q15_regr_bmi_shr,
      q15_bmi_shr_verylow,
      q15_bmi_shr_low,
      q15_bmi_shr_medium,
      q15_bmi_shr_medium_high,
      q15_bmi_shr_high,
      q15_bmi_shr_veryhigh,
      q15_bmi_shr_agg,
      q15_intake,
      q15_regr_kcal,
      q15_regr,
      q15_foodtree_kcal_animals,
      q15_foodtree_kcal_processed,
      q15_foodtree_kcal_staples,
      q15_foodtree_kcal_vegetables
  /;
In contrast, the equation q15_food_demand is part of MAgPIE, but not of the food demand model.
\[\begin{multline*} \left(vm\_dem\_food(i2,kfo) + \sum_{ct} f15\_household\_balanceflow(ct,i2,kfo,"dm")\right) \cdot \sum_{ct}\left(f15\_nutrition\_attributes(ct,kfo,"kcal") \cdot 10^{6}\right) \geq \sum_{ct}\left(im\_pop(ct,i2) \cdot p15\_kcal\_pc\_calibrated(ct,i2,kfo)\right) \cdot 365 \end{multline*}\]
Above constraint transforms the fooduse of agricultural products into per capita food demand. vm_dem_food is the fooduse of agricultural products. It is measured in tons of dry matter prior to processing. The multiplication with the nutrition attributes provides the equivalent in calories. While nutrition attributes are assumed to be globally the same (assumption of homogeneous products), a regional balance flow is used to account for current differences in food processing, where some regions get different calories from the same fooduse quantitiy. Depending on the input data, the balance flow may fade out in the future, which implies actual homogeneous products. The subsequent equations belong to the standalone food demand model, which is executed before MAgPIE or iterated with MAgPIE. They are excluded from the run of MAgPIE itself.
\[\begin{multline*} v15\_objective = \sum_{iso}\left( - 10^{6} \cdot v15\_income\_balance(iso)\right) \end{multline*}\]
In principle, the food demand model has only one solution that satifies all equations. Technically, the objective could therefore be chosen arbirtrarily, for the solver to find the single solution. However, if the model is executed outside its domain (e.g. with extreme price shocks), it can happen that real income takes a negative value (because the increase in food value exceeds the available income). To avoid this case, a punishment term v15_income_balance is introduced. It increases the real income, but affects the maximized objective variable negatively, disincentivizing its use in cases where it is not needed.
\[\begin{multline*} v15\_income\_pc\_real\_ppp\_iso(iso) = \sum_{kfo}\left( v15\_kcal\_regr(iso,kfo) \cdot 365 \cdot \left(i15\_prices\_initial\_kcal(iso,kfo)-\sum_{ct,curr\_iter15} p15\_prices\_kcal(ct,iso,kfo,curr\_iter15)\right)\right) + \sum_{ct}im\_gdp\_pc\_ppp\_iso(ct,iso) + v15\_income\_balance(iso) \end{multline*}\]
The budget constraint calculates the real income after a possible price shock. The basic assumption is that increasing prices reduce real income, while decreasing prices increase real income. Through this income effect, higher prices reduce the food demand. The income before the food price shock is im_gdp_pc_ppp_iso. It is reduced by the change in value of the demanded calories under changed prices. In the following, the real income is used to determine food intake, food demand as well as dietary composition. The BMI distribution within the population is calculated using regressions in a hierachical tree to estimate the share of the population falling into a certain BMI class.  First, the regression shares are calculated:
\[\begin{multline*} v15\_regr\_overgroups(iso,sex,agegroup15,bmi\_tree15) = i15\_bmi\_intercept(sex,agegroup15,bmi\_tree15) +\frac{ \left(i15\_bmi\_saturation(sex,agegroup15,bmi\_tree15) \cdot v15\_income\_pc\_real\_ppp\_iso(iso)\right) }{ \left(i15\_bmi\_halfsat(sex,agegroup15,bmi\_tree15) + v15\_income\_pc\_real\_ppp\_iso(iso)\right)} \end{multline*}\]
Then, these regression shares are applied to parameterize the hierarchical tree structure:
\[\begin{multline*} v15\_bmi\_shr\_overgroups(iso,sex,agegroup15,"verylow") = v15\_regr\_overgroups(iso,sex,agegroup15,"low") \cdot v15\_regr\_overgroups(iso,sex,agegroup15,"lowsplit") \end{multline*}\]
\[\begin{multline*} v15\_bmi\_shr\_overgroups(iso,sex,agegroup15,"low") = v15\_regr\_overgroups(iso,sex,agegroup15,"low") \cdot \left(1- v15\_regr\_overgroups(iso,sex,agegroup15,"lowsplit")\right) \end{multline*}\]
\[\begin{multline*} v15\_bmi\_shr\_overgroups(iso,sex,agegroup15,"medium") = \left(1-v15\_regr\_overgroups(iso,sex,agegroup15,"low") -v15\_regr\_overgroups(iso,sex,agegroup15,"high")\right) \cdot \left(1-v15\_regr\_overgroups(iso,sex,agegroup15,"mediumsplit")\right) \end{multline*}\]
\[\begin{multline*} v15\_bmi\_shr\_overgroups(iso,sex,agegroup15,"mediumhigh") = \left(1-v15\_regr\_overgroups(iso,sex,agegroup15,"low") -v15\_regr\_overgroups(iso,sex,agegroup15,"high")\right) \cdot v15\_regr\_overgroups(iso,sex,agegroup15,"mediumsplit") \end{multline*}\]
\[\begin{multline*} v15\_bmi\_shr\_overgroups(iso,sex,agegroup15,"high") = v15\_regr\_overgroups(iso,sex,agegroup15,"high") \cdot \left(1-v15\_regr\_overgroups(iso,sex,agegroup15,"highsplit")\right) \end{multline*}\]
\[\begin{multline*} v15\_bmi\_shr\_overgroups(iso,sex,agegroup15,"veryhigh") = v15\_regr\_overgroups(iso,sex,agegroup15,"high") \cdot v15\_regr\_overgroups(iso,sex,agegroup15,"highsplit") \end{multline*}\]
From BMI shares of the larger groups (overgroups), we disaggregate to age-specific subgroups.
\[\begin{multline*} v15\_bmi\_shr\_regr(iso,sex,age,bmi\_group15) = \sum_{agegroup2age(agegroup15,age)}\left( v15\_bmi\_shr\_overgroups(iso,sex,agegroup15,bmi\_group15) \right) \end{multline*}\]
Food intake is estimated based on BMI distribution, typical intakes for BMI groups, demographic structure and extra energy requirements for pregnancy and lactation (estimated based on the new-born population size).
\[\begin{multline*} v15\_kcal\_intake\_total\_regr(iso) \cdot \sum_{sex,age,ct} im\_demography(ct,iso,sex,age) = \sum_{ct, sex, age, bmi\_group15}\left( v15\_bmi\_shr\_regr(iso,sex,age,bmi\_group15) \cdot im\_demography(ct,iso,sex,age) \cdot p15\_intake(ct,iso,sex,age,bmi\_group15) \right) + \sum_{ct}i15\_kcal\_pregnancy(ct,iso) \end{multline*}\]
Food demand is based on food intake and a regression based on income, which estimates how much the actual demand is relative to the required intake. The difference between demand and intake is food waste (not explicitly mentioned in this equation)
\[\begin{multline*} v15\_kcal\_regr\_total(iso) = v15\_demand\_regr\left(iso, "overconsumption"\right) \cdot v15\_kcal\_intake\_total\_regr(iso) \end{multline*}\]
This equation estimates key dietary composition regressision factors, such as the share of animal products, empty calories, or fruits, vegetables and nuts.
\[\begin{multline*} v15\_demand\_regr\left(iso, regr15\right) = i15\_dem\_intercept(iso,regr15) +\frac{ \left(i15\_dem\_saturation(iso,regr15) \cdot v15\_income\_pc\_real\_ppp\_iso(iso)\right) }{ \left(i15\_dem\_halfsat(iso,regr15) + v15\_income\_pc\_real\_ppp\_iso(iso)^{i15\_dem\_nonsat(iso,regr15)}\right)} \end{multline*}\]
In the subsequent equations, those parameters are used to determine the dietary composition using a hierachical tree: Total calories are first divided into animal- and plant-based. The plant-based calories are further divided into processed empty calories and nutritious calories, and so on.
\[\begin{multline*} v15\_kcal\_regr(iso,kfo\_ap) = v15\_kcal\_regr\_total(iso) \cdot v15\_demand\_regr\left(iso, "livestockshare"\right) \cdot \sum_{ct}i15\_livestock\_kcal\_structure\_iso(ct,iso,kfo\_ap) \end{multline*}\]
\[\begin{multline*} v15\_kcal\_regr(iso,kfo\_pf) = v15\_kcal\_regr\_total(iso) \cdot \left(1 - v15\_demand\_regr\left(iso, "livestockshare"\right)\right) \cdot v15\_demand\_regr\left(iso, "processedshare"\right) \cdot \sum_{ct}i15\_processed\_kcal\_structure\_iso(ct,iso,kfo\_pf) \end{multline*}\]
\[\begin{multline*} v15\_kcal\_regr(iso,"others") = v15\_kcal\_regr\_total(iso) \cdot \left(1 - v15\_demand\_regr\left(iso, "livestockshare"\right)\right) \cdot \left(1 - v15\_demand\_regr\left(iso, "processedshare"\right)\right) \cdot v15\_demand\_regr\left(iso, "vegfruitshare"\right) \end{multline*}\]
\[\begin{multline*} v15\_kcal\_regr(iso,kfo\_st) = v15\_kcal\_regr\_total(iso) \cdot \left(1 - v15\_demand\_regr\left(iso, "livestockshare"\right)\right) \cdot \left(1 - v15\_demand\_regr\left(iso, "processedshare"\right)\right) \cdot \left(1 - v15\_demand\_regr\left(iso, "vegfruitshare"\right)\right) \cdot \sum_{ct}i15\_staples\_kcal\_structure\_iso(ct,iso,kfo\_st) \end{multline*}\]
Within the major food groups determined by the regressions (animal calories, empty calories, fruits, vegetable and nut calories as well as staple calories), the relative share of individual products (e.g. eggs within animal calories) is assumed to be constant. An exception is the demand for ruminant meat, which declines in the course of the century at the cost of chicken meat.
The calculations are executed in the following order:
In the beginning of each time step, the body height is estimated based on the diets of the previous 15 years. In case that the time step length exceeds 5 years, the consumption is extrapolated using the last two time steps. Body height is estimated using the consumption of proteins and fats, in our case the foodgroups animal products, pulses and oils. To estimate the body size of underaged (0-14 years), we scale the WHO body height recommendations for underaged with the divergence of the 15-19 year old. The body height estimates are repeated again at the end of the time step to improve the results of the extrapolation for cases where the time step length exceeds 5 years.
p15_bodyweight(t,iso,sex,age,bmi_group15)= f15_bmi(sex,age,bmi_group15) * (p15_bodyheight(t,iso,sex,age,"preliminary")/100)**2;Physical activity levels (PAL) relative to the basic metabolic rate (BMR) are estimated based on physical inactivity levels, assuming PALs for sedentary and medium-active populations of 1.53 and 1.76 respectively:
p15_physical_activity_level(t,iso,sex,age)=
                            im_physical_inactivity(t,iso,sex,age) * 1.53
                            +(1-im_physical_inactivity(t,iso,sex,age)) * 1.76
                            ;
p15_intake(t,iso,sex,age,bmi_group15)=
                        (f15_schofield(sex,age, "intercept")
                        + f15_schofield(sex,age, "slope")*p15_bodyweight(t,iso,sex,age,bmi_group15))
                        * p15_physical_activity_level(t,iso,sex,age);
Pregnancy and lactation require additional food intake. To account for this, newborns are distributed among reproductive women in a population. This number is then multiplied with the extra energy requirements:
i15_kcal_pregnancy(t,iso)=sum(sex,im_demography(t,iso,sex,"0--4")/5) * ((40/66)*845 + (26/66)*675);Before MAgPIE is executed, the food demand model is executed, at first without price shocks.
Per capita food demand and BMI shares are calibrated so that historical data are met. For this purpose, the residual between the regression fit and the observation is calculated for the historical period. When the historical period ends, the calibration factor is fixed at the value of the last historical time step. Additionally, a second calibration is required to meet the world totals of FAOSTAT food demand for different foods. While the food demand model estimates the demand for all countries of the world, FAOSTAT only covers a subset of countries. To match FAOSTAT totals, the food demand of countries not included in FAOSTAT is calibrated to zero. As this calibration is done ex-post, food demand estimates can still be used for all countries, but MAgPIE only considers demand from FAOSTAT countries.
if (sum(sameas(t_past,t),1) = 1,
    p15_kcal_calib(t,iso,kfo)$(sum(kfo2,f15_kcal_pc_iso(t,iso,kfo2))=0) = 0;
    p15_balanceflow_kcal_iso(t,iso,kfo)$(sum(kfo2,f15_kcal_pc_iso(t,iso,kfo2))>0) = 0;
    p15_kcal_calib(t,iso,kfo)$(sum(kfo2,f15_kcal_pc_iso(t,iso,kfo2))>0) = f15_kcal_pc_iso(t,iso,kfo) - v15_kcal_regr.l(iso, kfo);
    p15_balanceflow_kcal_iso(t,iso,kfo)$(sum(kfo2,f15_kcal_pc_iso(t,iso,kfo2))=0) = f15_kcal_pc_iso(t,iso,kfo) - v15_kcal_regr.l(iso, kfo);
    p15_kcal_calib_lastcalibyear(iso,kfo) = p15_kcal_calib(t,iso,kfo);
    p15_balanceflow_kcal_lastcalibyear(iso,kfo) = p15_balanceflow_kcal_iso(t,iso,kfo);
    i15_bmi_shr_calib(t,iso,sex,age,bmi_group15) =
                      f15_bmi_shr_past(t,iso,age,sex,bmi_group15) -
                      v15_bmi_shr_regr.l(iso,sex,age,bmi_group15);
    i15_bmi_shr_calib_lastcalibyear(iso,sex,age,bmi_group15)=
                      i15_bmi_shr_calib(t,iso,sex,age,bmi_group15);
else
Depending on the scenario switch c15_calibscen, the divergence of the demand from the historical data is kept constant or faded out.
p15_kcal_calib(t,iso,kfo) = p15_kcal_calib_lastcalibyear(iso,kfo) * f15_kcal_calib_fadeout(t,"%c15_calibscen%");The divergence of the kcal of countries with no FAOSTAT data is kept constant over time.
p15_balanceflow_kcal_iso(t,iso,kfo) = p15_balanceflow_kcal_lastcalibyear(iso,kfo);Depending on the scenario switch c15_calibscen, the divergence of the BMI shares from the historical data is kept constant over time or faded out.
   i15_bmi_shr_calib(t,iso,sex,age,bmi_group15) =
                     i15_bmi_shr_calib_lastcalibyear(iso,sex,age,bmi_group15)
                     * f15_kcal_calib_fadeout(t,"%c15_calibscen%");
);
s15_run_diet_postprocessing = 1;
$include "./modules/15_food/anthro_iso_jun22/exodietmacro.gms";
p15_kcal_pc_initial_iso(t,iso,kfo) = p15_kcal_pc_iso(t,iso,kfo);
pm_kcal_pc_initial(t,i,kfo) =  p15_kcal_pc(t,i,kfo);
o15_kcal_regr_initial(t,iso,kfo)=v15_kcal_regr.l(iso,kfo);
Now, MAgPIE is executed.
After one time step of MAgPIE is executed, the shadow prices of the food demand constraint are fed back into the food demand module, and the food demand module is executed once again.
    display "Coupling: Reading out marginal costs from MAgPIE";
    p15_prices_kcal(t,iso,kfo,curr_iter15)=sum(i_to_iso(i,iso), q15_food_demand.m(i,kfo));
display "starting m15_food_demand in iteration number ", p15_iteration_counter;
solve m15_food_demand USING nlp MAXIMIZING v15_objective;It is checked whether MAgPIE and the food demand model have reached sufficient convergence. The criterion for this is whether the real income in the food demand model has changed in any region by more than s15_convergences_measure relative to the last iteration due to changes in food prices from MAgPIE. Moreover, the model aborts when the number of iterations reaches s15_maxiter. As long as the iteration continues, the food prices are transferred from MAgPIE to the food demand model, and the food demand is transferred from the food demand model to MAgPIE.
After each execution of the food demand model, the body height distribution of the population is estimated. The starting point is the body height distribution of the last timestep. The body height estimates of the old period are moved into the subsequent age class (e.g. the 20-24 year old are now 25-29 years old). The age class of 15-19 year old is estimated newly using the body height regressions and the food consumption of the last 15 years.
   p15_bodyheight(t,iso,sex,"15--19","final") =
                     f15_bodyheight_regr_paras(sex,"slope")*
                     (sum(underaged15,
                       p15_kcal_growth_food(t,iso,underaged15)
                     )/3)**f15_bodyheight_regr_paras(sex,"exponent")
                     ;
The bodyheight of the underaged age class (0-14) is assumed to diverge from ‘normal’ body height by the same proportion as the age class of the 15-19 year old.
p15_bodyheight(t,iso,"M","0--4","final")=p15_bodyheight(t,iso,"M","15--19","final")/176*92;
p15_bodyheight(t,iso,"M","5--9","final")=p15_bodyheight(t,iso,"M","15--19","final")/176*125;
p15_bodyheight(t,iso,"M","10--14","final")=p15_bodyheight(t,iso,"M","15--19","final")/176*152;
p15_bodyheight(t,iso,"F","0--4","final")=p15_bodyheight(t,iso,"M","15--19","final")/163*91;
p15_bodyheight(t,iso,"F","5--9","final")=p15_bodyheight(t,iso,"M","15--19","final")/163*124;
p15_bodyheight(t,iso,"F","10--14","final")=p15_bodyheight(t,iso,"M","15--19","final")/163*154;
Finally, the regression outcome is calibrated by a country-specific additive term, which is the residual of the regression fit and observation of the last historical time step.
if (sum(sameas(t_past,t),1) = 1,
  p15_bodyheight_calib(t,iso,sex,age_new_estimated15) = f15_bodyheight(t,iso,sex,age_new_estimated15) - p15_bodyheight(t,iso,sex,age_new_estimated15,"final");
  p15_bodyheight(t,iso,sex,age_new_estimated15,"final") = f15_bodyheight(t,iso,sex,age_new_estimated15);
else
  p15_bodyheight_calib(t,iso,sex,age_new_estimated15)=p15_bodyheight_calib(t-1,iso,sex,age_new_estimated15);
  p15_bodyheight(t,iso,sex,age_new_estimated15,"final")=p15_bodyheight(t,iso,sex,age_new_estimated15,"final")+p15_bodyheight_calib(t,iso,sex,age_new_estimated15)*s15_calibrate;
);
as include statements are not allowed within the if statements, we execute the if statement before, put the result in s15_run_diet_postprocessing, and then execute the if statement again within the included file: This macro is executed twice, once after the presolve and once in the intersolve. It calibrates the values, includes exogenous diet modifications in the postprocessing and aggregates to regional level. The calibration factor is added to the regression value. Negative values that can possibly occur due to calibration are set to zero.
Transition to exogenous Planetary Health diet scenarios (Willett et al. 2019): It is possible to define exogenous diet scenarios that replace the regression-based calculation of food intake and demand according to a predefined speed of convergence from p15_kcal_pc_calibrated(t,iso,kfo) to the scenario-dependent target i15_kcal_pc_scen_target(t,iso,kfo) by setting the switch s15_exo_diet to 1.
if(s15_exo_diet = 1,1.) In a first step, the exogenous scenario diets are defined by selecting a scenario target for total daily per capita food intake
$ifthen "%c15_kcal_scen%" == "healthy_BMI"
  p15_bmi_shr_target(t,iso,sex,age,bmi_group15)=0;
  p15_bmi_shr_target(t,iso,sex,age,"medium")=1;
  i15_intake_scen_target(t,iso)$(sum((sex,age), im_demography(t,iso,sex,age)) >0 ) =
     (sum((sex, age, bmi_group15), p15_bmi_shr_target(t,iso,sex,age,bmi_group15)*
     im_demography(t,iso,sex,age)*p15_intake(t,iso,sex,age,bmi_group15) )
     + i15_kcal_pregnancy(t,iso))
     / sum((sex,age), im_demography(t,iso,sex,age));
$elseif "%c15_kcal_scen%" == "no_underweight"
  p15_bmi_shr_target(t,iso,sex,age,bmi_group15)=p15_bmi_shr_calibrated(t,iso,sex,age,bmi_group15);
  p15_bmi_shr_target(t,iso,sex,age,"medium")=
            p15_bmi_shr_calibrated(t,iso,sex,age,"verylow")
            + p15_bmi_shr_calibrated(t,iso,sex,age,"low")
            + p15_bmi_shr_calibrated(t,iso,sex,age,"medium");
  p15_bmi_shr_target(t,iso,sex,age,"verylow")=0;
  p15_bmi_shr_target(t,iso,sex,age,"low")=0;
  i15_intake_scen_target(t,iso)$(sum((sex,age), im_demography(t,iso,sex,age)) >0 ) =
     (sum((sex, age, bmi_group15), p15_bmi_shr_target(t,iso,sex,age,bmi_group15)*
     im_demography(t,iso,sex,age)*p15_intake(t,iso,sex,age,bmi_group15) )
     + i15_kcal_pregnancy(t,iso))
     / sum((sex,age), im_demography(t,iso,sex,age));
$elseif "%c15_kcal_scen%" == "no_overweight"
  p15_bmi_shr_target(t,iso,sex,age,bmi_group15)=p15_bmi_shr_calibrated(t,iso,sex,age,bmi_group15);
  p15_bmi_shr_target(t,iso,sex,age,"medium")=
            p15_bmi_shr_calibrated(t,iso,sex,age,"mediumhigh")
            + p15_bmi_shr_calibrated(t,iso,sex,age,"high")
            + p15_bmi_shr_calibrated(t,iso,sex,age,"veryhigh")
            + p15_bmi_shr_calibrated(t,iso,sex,age,"medium");
  p15_bmi_shr_target(t,iso,sex,age,"mediumhigh")=0;
  p15_bmi_shr_target(t,iso,sex,age,"high")=0;
  p15_bmi_shr_target(t,iso,sex,age,"veryhigh")=0;
  i15_intake_scen_target(t,iso)$(sum((sex,age), im_demography(t,iso,sex,age)) >0 ) =
     (sum((sex, age, bmi_group15), p15_bmi_shr_target(t,iso,sex,age,bmi_group15)*
     im_demography(t,iso,sex,age)*p15_intake(t,iso,sex,age,bmi_group15) )
     + i15_kcal_pregnancy(t,iso))
     / sum((sex,age), im_demography(t,iso,sex,age));
$elseif "%c15_kcal_scen%" == "endo"
  i15_intake_scen_target(t,iso) = p15_intake_total(t,iso);
  p15_bmi_shr_target(t,iso,sex,age,bmi_group15) = p15_bmi_shr_calibrated(t,iso,sex,age,bmi_group15);
$else
  i15_intake_scen_target(t,iso) = sum(kfo,i15_intake_EATLancet_all(iso,"%c15_kcal_scen%","%c15_EAT_scen%",kfo));
  p15_bmi_shr_target(t,iso,sex,age,bmi_group15)=0;
  p15_bmi_shr_target(t,iso,sex,age,"medium")=1;
$endif
Intake target is adjusted to meet the calorie target
  i15_intake_detailed_scen_target(t,iso,kfo)$(p15_intake_total(t,iso)>0) =
    p15_intake_detail(t,iso,kfo) / p15_intake_total(t,iso) * i15_intake_scen_target(t,iso);
2.) The second step defines the daily per capita intake of different food commodities by filling up the scenario target for total daily per capita food intake according to different scenario assumptions on dietary patterns. Calories for staple crops can be modified in order to meet the total calorie target. The EAT lancet target values are the same for non-staples irrespective of the calorie target Only non-staples differ
    i15_intake_EATLancet(iso,kfo) =
          i15_intake_EATLancet_all(iso,"2100kcal","%c15_EAT_scen%",kfo);
    if (s15_exo_monogastric=1,
      i15_intake_detailed_scen_target(t,iso,EAT_monogastrics15) = i15_intake_EATLancet(iso,EAT_monogastrics15));
    if (s15_exo_ruminant=1,
        i15_intake_detailed_scen_target(t,iso,EAT_ruminants15) = i15_intake_EATLancet(iso,EAT_ruminants15));
    if (s15_exo_fish=1,
        i15_intake_detailed_scen_target(t,iso,"fish") = i15_intake_EATLancet(iso,"fish"));
    if (s15_exo_fruitvegnut=1,
      i15_intake_detailed_scen_target(t,iso,EAT_fruitvegnutseed15) = i15_intake_EATLancet(iso,EAT_fruitvegnutseed15));
    if (s15_exo_pulses=1,
      i15_intake_detailed_scen_target(t,iso,EAT_pulses15) = i15_intake_EATLancet(iso,EAT_pulses15));
    if (s15_exo_sugar=1,
      i15_intake_detailed_scen_target(t,iso,EAT_sugar15) = i15_intake_EATLancet(iso,EAT_sugar15));
    if (s15_exo_oils=1,
      i15_intake_detailed_scen_target(t,iso,"oils") = i15_intake_EATLancet(iso,"oils"));
    if (s15_exo_brans=1,
      i15_intake_detailed_scen_target(t,iso,"brans") = i15_intake_EATLancet(iso,"brans"));
    if (s15_exo_scp=1,
      i15_intake_detailed_scen_target(t,iso,"scp") = i15_intake_EATLancet(iso,"scp"));
    if (s15_exo_alcohol=1,
      i15_intake_detailed_scen_target(t,iso,"alcohol")$(i15_intake_detailed_scen_target(t,iso,"alcohol") > s15_alc_scen*i15_intake_scen_target(t,iso))
        = s15_alc_scen*i15_intake_scen_target(t,iso);
    );
    i15_intake_detailed_scen_target(t,iso,EAT_staples)$(sum(EAT_staples2,i15_intake_EATLancet(iso,EAT_staples2))>0) = (
              i15_intake_scen_target(t,iso) - sum(EAT_nonstaples,i15_intake_detailed_scen_target(t,iso,EAT_nonstaples)) )*(
              i15_intake_EATLancet(iso,EAT_staples)/sum(EAT_staples2,i15_intake_EATLancet(iso,EAT_staples2)) );
3.) In the third step, the regression-based calculation of intake is faded into the exogenous intake scenario according to a predefined speed of convergence (note that fading should start after the historical time slice of the EAT Lancet diet scenarios (y2010) as defined in i15_exo_foodscen_fader(t,iso)):
  p15_intake_detail(t,iso,kfo) = p15_intake_detail(t,iso,kfo) * (1-i15_exo_foodscen_fader(t,iso))
                      + i15_intake_detailed_scen_target(t,iso,kfo) * i15_exo_foodscen_fader(t,iso);
  p15_bmi_shr_calibrated(t,iso,sex,age,bmi_group15) = p15_bmi_shr_calibrated(t,iso,sex,age,bmi_group15) * (1-i15_exo_foodscen_fader(t,iso))
                      + p15_bmi_shr_target(t,iso,sex,age,bmi_group15) * i15_exo_foodscen_fader(t,iso);
4.) The fourth step estimates the calorie supply at household level by multiplying daily per capita calorie intake with the demand2intake ratio that was estimated previously. It assures that if commodities with higher food waste ratio are increasingly consumed, food waste increases.
  p15_kcal_pc_iso(t,iso,kfo) = p15_intake_detail(t,iso,kfo)
                                  *p15_demand2intake_ratio_detail(t,iso,kfo);
Total waste share and total intake are adapted to new calculations.
  p15_intake_total(t,iso) = sum(kfo, p15_intake_detail(t,iso,kfo));
  p15_waste_pc(t,iso,kfo) = p15_kcal_pc_iso(t,iso,kfo) - p15_intake_detail(t,iso,kfo);
  p15_demand2intake_ratio(t,iso) = 1$(p15_intake_total(t,iso) = 0) +
         (sum(kfo,p15_kcal_pc_iso(t,iso,kfo)) / p15_intake_total(t,iso))$(
           p15_intake_total(t,iso) > 0);
  p15_demand2intake_ratio_detail(t,iso,kfo)=1$(p15_intake_detail(t,iso,kfo) = 0) +
  (p15_kcal_pc_iso(t,iso,kfo) / p15_intake_detail(t,iso,kfo))$(p15_intake_detail(t,iso,kfo) > 0);
);
End of special postprocessing food demand scenarios.
if(s15_exo_waste = 1,“Downwards convergence” of regional calorie oversupply due to food waste to the waste reduction target, i.e. only for values that are higher than the target:
    p15_demand2intake_ratio(t,iso)$(p15_demand2intake_ratio(t,iso) > s15_waste_scen )
                      = p15_demand2intake_ratio(t,iso)*(1-i15_exo_foodscen_fader(t,iso))
                        + s15_waste_scen*i15_exo_foodscen_fader(t,iso);
waste calculation by crop type
    p15_waste_pc(t,iso,kfo)$(sum(kfo2, p15_waste_pc(t,iso,kfo2))<>0) = p15_waste_pc(t,iso,kfo) / sum(kfo2, p15_waste_pc(t,iso,kfo2))*
                  (p15_intake_total(t,iso)*p15_demand2intake_ratio(t,iso)-p15_intake_total(t,iso));
Waste ratio is applied
    p15_kcal_pc_iso(t,iso,kfo) = p15_intake_detail(t,iso,kfo) + p15_waste_pc(t,iso,kfo);
    p15_demand2intake_ratio_detail(t,iso,kfo)=1$(p15_intake_detail(t,iso,kfo) = 0) +
                  (p15_kcal_pc_iso(t,iso,kfo) / p15_intake_detail(t,iso,kfo))$(p15_intake_detail(t,iso,kfo) > 0);
);
The country-level parameter p15_kcal_pc_iso is aggregated to the regional level. After removing estimates from countries that are not included in FAOSTAT, the resulting parameter p15_kcal_pc_calibrated is provided to constraint q15_food_demand in the MAgPIE model, which defines the demand for food. Results are aggregated to regions
   p15_kcal_pc(t,i,kfo)$(
      sum(i_to_iso(i,iso),
         im_pop_iso(t,iso)
      ) >0 ) =
               sum(i_to_iso(i,iso),
                 p15_kcal_pc_iso(t,iso,kfo)
                 * im_pop_iso(t,iso)
               ) / sum(i_to_iso(i,iso),
                   im_pop_iso(t,iso)
               );
   p15_balanceflow_kcal(t,i,kfo)$(
      sum(i_to_iso(i,iso),
         im_pop_iso(t,iso)
      ) >0 ) =
               sum(i_to_iso(i,iso),
                 p15_balanceflow_kcal_iso(t,iso,kfo)
                 * im_pop_iso(t,iso)
               ) / sum(i_to_iso(i,iso),
                   im_pop_iso(t,iso)
               );
Finally, we calibrate countries with zero food demand according to FAOSTAT down to zero to match FAO world totals. Values are rounded to avoid path dependencies of MAgPIE solver.
   p15_kcal_pc_calibrated(t,i,kfo)=p15_kcal_pc(t,i,kfo)+p15_balanceflow_kcal(t,i,kfo);
   p15_kcal_pc_calibrated(t,i,kfo)=round(p15_kcal_pc_calibrated(t,i,kfo),2);
   p15_kcal_pc_calibrated(t,i,kfo)$(p15_kcal_pc_calibrated(t,i,kfo)<0)=0;
Limitations There are no known limitations.
The realization anthropometrics_jan18 uses per capita income and the demography of the world population (including sex and age classes at the country level, which are provided from module 09_drivers) as drivers. The module estimates food demand on iso-country level taking anthropometric food requirements as well as economic dynamics into account. If flexible demand is activated, the module also uses the shadow prices for agircultural products from the optimization, which are the Lagrange multipliers of the constraint q15_food_demand. The module consists of a standalone food demand model, which is executed before MAgPIE starts. In the case of endogenous demand, the module is iterated with MAgPIE. Besides providing the fooduse of agricultural products, the model also provides a number of output indicators, including the BMI distribution, body weight and height of the population by age and sex, food intake by age group and sex, food waste, dietary composition between livestock products, empty calories (sugar, oil and alcohol), fruits vegetables and nuts, as well as staple calories. The food demand model can be run in standalone mode by running the the file standalone/demand_model.gms. The model is described in (Bodirsky et al. 2020)
The food demand model consists of the following equations, which are not part of MAgPIE.
model m15_food_demand /
      q15_aim,
      q15_budget,
      q15_regr_bmi_shr,
      q15_bmi_shr_verylow,
      q15_bmi_shr_low,
      q15_bmi_shr_medium,
      q15_bmi_shr_medium_high,
      q15_bmi_shr_high,
      q15_bmi_shr_veryhigh,
      q15_bmi_shr_agg,
      q15_intake,
      q15_regr_kcal,
      q15_regr,
      q15_foodtree_kcal_animals,
      q15_foodtree_kcal_processed,
      q15_foodtree_kcal_staples,
      q15_foodtree_kcal_vegetables
  /;
In contrast, the equation q15_food_demand is part of MAgPIE, but not of the food demand model.
\[\begin{multline*} \left(vm\_dem\_food(i2,kfo) + \sum_{ct} f15\_household\_balanceflow(ct,i2,kfo,"dm")\right) \cdot \sum_{ct}\left(f15\_nutrition\_attributes(ct,kfo,"kcal") \cdot 10^{6}\right) \geq \sum_{ct}\left(im\_pop(ct,i2) \cdot p15\_kcal\_pc\_calibrated(ct,i2,kfo)\right) \cdot 365 \end{multline*}\]
Above constraint transforms the fooduse of agricultural products into per capita food demand. vm_dem_food is the fooduse of agricultural products. It is measured in tons of dry matter prior to processing. The multiplication with the nutrition attributes provides the equivalent in calories. While nutrition attributes are assumed to be globally the same (assumption of homogeneous products), a regional balance flow is used to account for current differences in food processing, where some regions get different calories from the same fooduse quantitiy. Depending on the input data, the balance flow may fade out in the future, which implies actual homogeneous products. The subsequent equations belong to the standalone food demand model, which is executed before MAgPIE or iterated with MAgPIE. They are excluded from the run of MAgPIE itself.
\[\begin{multline*} v15\_objective = \sum_{iso}\left( - 10^{6} \cdot v15\_income\_balance(iso)\right) \end{multline*}\]
In principle, the food demand model has only one solution that satifies all equations. Technically, the objective could therefore be chosen arbirtrarily, for the solver to find the single solution. However, if the model is executed outside its domain (e.g. with extreme price shocks), it can happen that real income takes a negative value (because the increase in food value exceeds the available income). To avoid this case, a punishment term v15_income_balance is introduced. It increases the real income, but affects the maximized objective variable negatively, disincentivizing its use in cases where it is not needed.
\[\begin{multline*} v15\_income\_pc\_real\_ppp\_iso(iso) = \sum_{kfo}\left( v15\_kcal\_regr(iso,kfo) \cdot 365 \cdot \left(i15\_prices\_initial\_kcal(iso,kfo)-\sum_{ct,curr\_iter15} p15\_prices\_kcal(ct,iso,kfo,curr\_iter15)\right)\right) + \sum_{ct}im\_gdp\_pc\_ppp\_iso(ct,iso) + v15\_income\_balance(iso) \end{multline*}\]
The budget constraint calculates the real income after a possible price shock. The basic assumption is that increasing prices reduce real income, while decreasing prices increase real income. Through this income effect, higher prices reduce the food demand. The income before the food price shock is im_gdp_pc_ppp_iso. It is reduced by the change in value of the demanded calories under changed prices. In the following, the real income is used to determine food intake, food demand as well as dietary composition. The BMI distribution within the population is calculated using regressions in a hierachical tree to estimate the share of the population falling into a certain BMI class. First, the regression shares are calculated:
\[\begin{multline*} v15\_regr\_overgroups(iso,sex,agegroup15,bmi\_tree15) = i15\_bmi\_intercept(sex,agegroup15,bmi\_tree15) +\frac{ \left(i15\_bmi\_saturation(sex,agegroup15,bmi\_tree15) \cdot v15\_income\_pc\_real\_ppp\_iso(iso)\right) }{ \left(i15\_bmi\_halfsat(sex,agegroup15,bmi\_tree15) + v15\_income\_pc\_real\_ppp\_iso(iso)\right)} \end{multline*}\]
Then, these regression shares are applied to parameterize the hierarchical tree structure:
\[\begin{multline*} v15\_bmi\_shr\_overgroups(iso,sex,agegroup15,"verylow") = v15\_regr\_overgroups(iso,sex,agegroup15,"low") \cdot v15\_regr\_overgroups(iso,sex,agegroup15,"lowsplit") \end{multline*}\]
\[\begin{multline*} v15\_bmi\_shr\_overgroups(iso,sex,agegroup15,"low") = v15\_regr\_overgroups(iso,sex,agegroup15,"low") \cdot \left(1- v15\_regr\_overgroups(iso,sex,agegroup15,"lowsplit")\right) \end{multline*}\]
\[\begin{multline*} v15\_bmi\_shr\_overgroups(iso,sex,agegroup15,"medium") = \left(1-v15\_regr\_overgroups(iso,sex,agegroup15,"low") -v15\_regr\_overgroups(iso,sex,agegroup15,"high")\right) \cdot \left(1-v15\_regr\_overgroups(iso,sex,agegroup15,"mediumsplit")\right) \end{multline*}\]
\[\begin{multline*} v15\_bmi\_shr\_overgroups(iso,sex,agegroup15,"mediumhigh") = \left(1-v15\_regr\_overgroups(iso,sex,agegroup15,"low") -v15\_regr\_overgroups(iso,sex,agegroup15,"high")\right) \cdot v15\_regr\_overgroups(iso,sex,agegroup15,"mediumsplit") \end{multline*}\]
\[\begin{multline*} v15\_bmi\_shr\_overgroups(iso,sex,agegroup15,"high") = v15\_regr\_overgroups(iso,sex,agegroup15,"high") \cdot \left(1-v15\_regr\_overgroups(iso,sex,agegroup15,"highsplit")\right) \end{multline*}\]
\[\begin{multline*} v15\_bmi\_shr\_overgroups(iso,sex,agegroup15,"veryhigh") = v15\_regr\_overgroups(iso,sex,agegroup15,"high") \cdot v15\_regr\_overgroups(iso,sex,agegroup15,"highsplit") \end{multline*}\]
From BMI shares of the larger groups (overgroups), we disaggregate to age-specific subgroups.
\[\begin{multline*} v15\_bmi\_shr\_regr(iso,sex,age,bmi\_group15) = \sum_{agegroup2age(agegroup15,age)}\left( v15\_bmi\_shr\_overgroups(iso,sex,agegroup15,bmi\_group15) \right) \end{multline*}\]
Food intake is estimated based on BMI distribution, typical intakes for BMI groups, demographic structure and extra energy requirements for pregnancy and lactation (estimated based on the new-born population size).
\[\begin{multline*} v15\_kcal\_intake\_total\_regr(iso) \cdot \sum_{sex,age,ct} im\_demography(ct,iso,sex,age) = \sum_{ct, sex, age, bmi\_group15}\left( v15\_bmi\_shr\_regr(iso,sex,age,bmi\_group15) \cdot im\_demography(ct,iso,sex,age) \cdot p15\_intake(ct,iso,sex,age,bmi\_group15) \right) + \sum_{ct}i15\_kcal\_pregnancy(ct,iso) \end{multline*}\]
Food demand is based on food intake and a regression based on income, which estimates how much the actual demand is relative to the required intake. The difference between demand and intake is food waste (not explicitly mentioned in this equation)
\[\begin{multline*} v15\_kcal\_regr\_total(iso) = v15\_demand\_regr\left(iso, "overconsumption"\right) \cdot v15\_kcal\_intake\_total\_regr(iso) \end{multline*}\]
This equation estimates key dietary composition regressision factors, such as the share of animal products, empty calories, or fruits, vegetables and nuts.
\[\begin{multline*} v15\_demand\_regr\left(iso, regr15\right) = i15\_dem\_intercept(iso,regr15) +\frac{ \left(i15\_dem\_saturation(iso,regr15) \cdot v15\_income\_pc\_real\_ppp\_iso(iso)\right) }{ \left(i15\_dem\_halfsat(iso,regr15) + v15\_income\_pc\_real\_ppp\_iso(iso)^{i15\_dem\_nonsat(iso,regr15)}\right)} \end{multline*}\]
In the subsequent equations, those parameters are used to determine the dietary composition using a hierachical tree: Total calories are first divided into animal- and plant-based. The plant-based calories are further divided into processed empty calories and nutritious calories, and so on.
\[\begin{multline*} v15\_kcal\_regr(iso,kfo\_ap) = v15\_kcal\_regr\_total(iso) \cdot v15\_demand\_regr\left(iso, "livestockshare"\right) \cdot \sum_{ct}i15\_livestock\_kcal\_structure\_iso(ct,iso,kfo\_ap) \end{multline*}\]
\[\begin{multline*} v15\_kcal\_regr(iso,kfo\_pf) = v15\_kcal\_regr\_total(iso) \cdot \left(1 - v15\_demand\_regr\left(iso, "livestockshare"\right)\right) \cdot v15\_demand\_regr\left(iso, "processedshare"\right) \cdot \sum_{ct}i15\_processed\_kcal\_structure\_iso(ct,iso,kfo\_pf) \end{multline*}\]
\[\begin{multline*} v15\_kcal\_regr(iso,"others") = v15\_kcal\_regr\_total(iso) \cdot \left(1 - v15\_demand\_regr\left(iso, "livestockshare"\right)\right) \cdot \left(1 - v15\_demand\_regr\left(iso, "processedshare"\right)\right) \cdot v15\_demand\_regr\left(iso, "vegfruitshare"\right) \end{multline*}\]
\[\begin{multline*} v15\_kcal\_regr(iso,kfo\_st) = v15\_kcal\_regr\_total(iso) \cdot \left(1 - v15\_demand\_regr\left(iso, "livestockshare"\right)\right) \cdot \left(1 - v15\_demand\_regr\left(iso, "processedshare"\right)\right) \cdot \left(1 - v15\_demand\_regr\left(iso, "vegfruitshare"\right)\right) \cdot \sum_{ct}i15\_staples\_kcal\_structure\_iso(ct,iso,kfo\_st) \end{multline*}\]
Within the major food groups determined by the regressions (animal calories, empty calories, fruits, vegetable and nut calories as well as staple calories), the relative share of individual products (e.g. eggs within animal calories) is assumed to be constant. An exception is the demand for ruminant meat, which declines in the course of the century at the cost of chicken meat.
The calculations are executed in the following order:
In the beginning of each time step, the body height is estimated based on the diets of the previous 15 years. In case that the time step length exceeds 5 years, the consumption is extrapolated using the last two time steps. Body height is estimated using the consumption of proteins and fats, in our case the foodgroups animal products, pulses and oils. To estimate the body size of underaged (0-14 years), we scale the WHO body height recommendations for underaged with the divergence of the 15-19 year old. The body height estimates are repeated again at the end of the time step to improve the results of the extrapolation for cases where the time step length exceeds 5 years.
p15_bodyweight(t,iso,sex,age,bmi_group15)= f15_bmi(sex,age,bmi_group15) * (p15_bodyheight(t,iso,sex,age,"preliminary")/100)**2;Physical activity levels (PAL) relative to the basic metabolic rate (BMR) are estimated based on physical inactivity levels, assuming PALs for sedentary and medium-active populations of 1.53 and 1.76 respectively:
p15_physical_activity_level(t,iso,sex,age)=
                            im_physical_inactivity(t,iso,sex,age) * 1.53
                            +(1-im_physical_inactivity(t,iso,sex,age)) * 1.76
                            ;
p15_intake(t,iso,sex,age,bmi_group15)=
                        (f15_schofield(sex,age, "intercept")
                        + f15_schofield(sex,age, "slope")*p15_bodyweight(t,iso,sex,age,bmi_group15))
                        * p15_physical_activity_level(t,iso,sex,age);
Pregnancy and lactation require additional food intake. To account for this, newborns are distributed among reproductive women in a population. This number is then multiplied with the extra energy requirements:
i15_kcal_pregnancy(t,iso)=sum(sex,im_demography(t,iso,sex,"0--4")/5) * ((40/66)*845 + (26/66)*675);Before MAgPIE is executed, the food demand model is executed, at first without price shocks.
Per capita food demand and BMI shares are calibrated so that historical data are met. For this purpose, the residual between the regression fit and the observation is calculated for the historical period. When the historical period ends, the calibration factor is fixed at the value of the last historical time step. Additionally, a second calibration is required to meet the world totals of FAOSTAT food demand for different foods. While the food demand model estimates the demand for all countries of the world, FAOSTAT only covers a subset of countries. To match FAOSTAT totals, the food demand of countries not included in FAOSTAT is calibrated to zero. As this calibration is done ex-post, food demand estimates can still be used for all countries, but MAgPIE only considers demand from FAOSTAT countries.
if (sum(sameas(t_past,t),1) = 1,
    p15_kcal_calib(t,iso,kfo)$(sum(kfo2,f15_kcal_pc_iso(t,iso,kfo2))=0) = 0;
    p15_balanceflow_kcal_iso(t,iso,kfo)$(sum(kfo2,f15_kcal_pc_iso(t,iso,kfo2))>0) = 0;
    p15_kcal_calib(t,iso,kfo)$(sum(kfo2,f15_kcal_pc_iso(t,iso,kfo2))>0) = f15_kcal_pc_iso(t,iso,kfo) - v15_kcal_regr.l(iso, kfo);
    p15_balanceflow_kcal_iso(t,iso,kfo)$(sum(kfo2,f15_kcal_pc_iso(t,iso,kfo2))=0) = f15_kcal_pc_iso(t,iso,kfo) - v15_kcal_regr.l(iso, kfo);
    p15_kcal_calib_lastcalibyear(iso,kfo) = p15_kcal_calib(t,iso,kfo);
    p15_balanceflow_kcal_lastcalibyear(iso,kfo) = p15_balanceflow_kcal_iso(t,iso,kfo);
    i15_bmi_shr_calib(t,iso,sex,age,bmi_group15) =
                      f15_bmi_shr_past(t,iso,age,sex,bmi_group15) -
                      v15_bmi_shr_regr.l(iso,sex,age,bmi_group15);
    i15_bmi_shr_calib_lastcalibyear(iso,sex,age,bmi_group15)=
                      i15_bmi_shr_calib(t,iso,sex,age,bmi_group15);
else
Depending on the scenario switch c15_calibscen, the divergence of the demand from the historical data is kept constant or faded out.
p15_kcal_calib(t,iso,kfo) = p15_kcal_calib_lastcalibyear(iso,kfo) * f15_kcal_calib_fadeout(t,"%c15_calibscen%");The divergence of the kcal of countries with no FAOSTAT data is kept constant over time.
p15_balanceflow_kcal_iso(t,iso,kfo) = p15_balanceflow_kcal_lastcalibyear(iso,kfo);Depending on the scenario switch c15_calibscen, the divergence of the BMI shares from the historical data is kept constant over time or faded out.
   i15_bmi_shr_calib(t,iso,sex,age,bmi_group15) =
                     i15_bmi_shr_calib_lastcalibyear(iso,sex,age,bmi_group15)
                     * f15_kcal_calib_fadeout(t,"%c15_calibscen%");
);
The calibration factor is added to the regression value.
   p15_kcal_pc_iso(t,iso,kfo) =
          v15_kcal_regr.l(iso,kfo) + p15_kcal_calib(t,iso,kfo) * s15_calibrate;
Negative values that can possibly occur due to calibration are set to zero.
p15_kcal_pc_iso(t,iso,kfo)$(p15_kcal_pc_iso(t,iso,kfo)<0) = 0;The country-level parameter p15_kcal_pc_iso is aggregated to the regional level. After removing estimates from countries that are not included in FAOSTAT, the resulting parameter p15_kcal_pc_calibrated is provided to constraint q15_food_demand in the MAgPIE model, which defines the demand for food.
Transition to exogenous EAT Lancet diet scenarios: It is possible to define exogenous diet scenarios that replace the regression-based calculation of food intake and demand according to a predefined speed of convergence from p15_kcal_pc_calibrated(t,i,kfo) to the scenario-dependent target i15_kcal_pc_scen_target(t,i,kfo) by setting the switch s15_exo_diet to 1.
if(s15_exo_diet = 1,
$ifthen "%c15_exo_foodscen%" == "lin_zero_20_30"
  i15_intake_EATLancet_all(i,kcal_scen15,EAT_scen15,kfo) = f15_intake_EATLancet("y2030",i,kcal_scen15,EAT_scen15,kfo);
$else
  i15_intake_EATLancet_all(i,kcal_scen15,EAT_scen15,kfo) = f15_intake_EATLancet("y2050",i,kcal_scen15,EAT_scen15,kfo);
$endif
1.) In a first step, the exogenous scenario diets are defined by selecting a scenario target for total daily per capita food intake and by choosing food-specific dietary patterns:
$ifthen "%c15_kcal_scen%" == "healthy_BMI"
  i15_intake_scen_target(t,i) = sum(i_to_iso(i,iso),
        sum((sex, age), im_demography(t,iso,sex,age)*p15_intake(t,iso,sex,age,"medium") )
         + i15_kcal_pregnancy(t,iso)
         ) / sum(i_to_iso(i,iso),
             sum((sex,age), im_demography(t,iso,sex,age))
         );
  i15_intake_EATLancet(i,kfo) =
        i15_intake_EATLancet_all(i,"2100kcal","%c15_EAT_scen%",kfo);
$else
  i15_intake_EATLancet(i,kfo) =
        i15_intake_EATLancet_all(i,"%c15_kcal_scen%","%c15_EAT_scen%",kfo);
        i15_intake_scen_target(t,i) = sum(kfo,i15_intake_EATLancet(i,kfo));
$endif
2.) The second step defines the daily per capita intake of different food commodities by filling up the scenario target for total daily per capita food intake according to different scenario assumptions on dietary patterns. Calories for staple crops can be modified in order to meet the total calorie target.
p15_intake_detailed_regr(t,i,kfo) = p15_kcal_pc_calibrated(t,i,kfo)
        /(f15_calib_fsupply(i)*f15_overcons_FAOwaste(i,kfo)*p15_foodwaste_growth(t,i));
i15_intake_detailed_scen_target(t,i,EAT_nonstaples) = i15_intake_EATLancet(i,EAT_nonstaples);
if(s15_alc_scen>0,
i15_intake_detailed_scen_target(t,i,"alcohol") = p15_intake_detailed_regr(t,i,"alcohol");
i15_intake_detailed_scen_target(t,i,"alcohol")$(i15_intake_detailed_scen_target(t,i,"alcohol") > s15_alc_scen*i15_intake_scen_target(t,i))
    = s15_alc_scen*i15_intake_scen_target(t,i);
);
i15_intake_detailed_scen_target(t,i,EAT_staples) = (
          i15_intake_scen_target(t,i) - sum(EAT_nonstaples,i15_intake_EATLancet(i,EAT_nonstaples)) )*(
          i15_intake_EATLancet(i,EAT_staples)/sum(EAT_staples2,i15_intake_EATLancet(i,EAT_staples2)) );
3.) The third step estimates the calorie supply at household level by multiplying daily per capita calorie intake with a ratio of supply to intake (f15_overcons_FAOwaste(i,kfo)), based on FAO estimates on historical food waste at consumption level and food conversion factors, and with a calibration factor f15_calib_fsupply(i). This factor ensures that the estimated food supply (based on MAgPIE calorie intake, FAO waste shares and food converion factors) is calibrated to FAO food supply for the only historical time slice of the EAT Lancet diet scenarios (y2010). A multiplicative factor accounts for increases in food waste over time relative to the only historical time slice of the EAT Lancet diet scenarios, according to the regression-based approach.
i15_kcal_pc_scen_target(t,i,kfo) = (f15_calib_fsupply(i)*f15_overcons_FAOwaste(i,kfo)
                                    *i15_intake_detailed_scen_target(t,i,kfo))
                                    *p15_foodwaste_growth(t,i);
4.) In the last step, the regression-based calculation of daily per capita food demand is faded into the exogenous diet scenario according to a predefined speed of convergence (note that fading should start after the historical time slice of the EAT Lancet diet scenarios (y2010) as defined in i15_exo_foodscen_fader(t,i)):
p15_kcal_pc_calibrated_orig(t,i,kfo) = p15_kcal_pc_calibrated(t,i,kfo);
p15_kcal_pc_calibrated(t,i,kfo) = p15_kcal_pc_calibrated_orig(t,i,kfo) * (1-i15_exo_foodscen_fader(t,i))
                        + i15_kcal_pc_scen_target(t,i,kfo) * i15_exo_foodscen_fader(t,i);
);
Now, MAgPIE is executed.
After one time step of MAgPIE is executed, the shadow prices of the food demand constraint are fed back into the food demand module, and the food demand module is executed once again.
If s15_elastic_demand is 0, MAgPIE is not executed again for this time step. In case that s15_elastic_demand is 1, it is checked whether MAgPIE and the food demand model have reached sufficient convergence. The criterion for this is whether the real income in the food demand model has changed in any region by more than s15_convergences_measure relative to the last iteration due to changes in food prices from MAgPIE. Moreover, the model aborts when the number of iterations reaches s15_maxiter. As long as the iteration continues, the food prices are transferred from MAgPIE to the food demand model, and the food demand is transferred from the food demand model to MAgPIE.
Transition to exogenous EAT Lancet diet scenarios: A part of the definition of exogenous diet scenarios is already accomplished in the presolve.gms, where the parameters i15_intake_scen_target(t,i) and i15_intake_EATLancet(i,kfo) are calculated.
if(s15_exo_diet = 1,
  p15_intake_detailed_regr(t,i,kfo) = p15_kcal_pc_calibrated(t,i,kfo)
         /(f15_calib_fsupply(i)*f15_overcons_FAOwaste(i,kfo)*p15_foodwaste_growth(t,i));
  if(s15_alc_scen>0,
    i15_intake_detailed_scen_target(t,i,"alcohol") = p15_intake_detailed_regr(t,i,"alcohol");
    i15_intake_detailed_scen_target(t,i,"alcohol")$(i15_intake_detailed_scen_target(t,i,"alcohol") > s15_alc_scen*i15_intake_scen_target(t,i))
       = s15_alc_scen*i15_intake_scen_target(t,i);
     );
  i15_intake_detailed_scen_target(t,i,EAT_staples) = (
          i15_intake_scen_target(t,i) - sum(EAT_nonstaples,i15_intake_EATLancet(i,EAT_nonstaples)) )*(
          i15_intake_EATLancet(i,EAT_staples)/sum(EAT_staples2,i15_intake_EATLancet(i,EAT_staples2)) );
Now, the calorie supply at household level is calculated by multiplying daily per capita calorie intake with a ratio of supply to intake (f15_overcons_FAOwaste(i,kfo)) based on FAO estimates on historical food waste at consumption level and food conversion factors, and with a calibration factor f15_calib_fsupply(i). Another multiplicative factor accounts for increases in food waste over time.
    i15_kcal_pc_scen_target(t,i,kfo) = (f15_calib_fsupply(i)*f15_overcons_FAOwaste(i,kfo)
                                    *i15_intake_detailed_scen_target(t,i,kfo))
                                    *p15_foodwaste_growth(t,i);
In the last step, the regression-based calculation of daily per capita food demand is faded into the exogenous diet scenario according to a predefined spped of convergence:
    p15_kcal_pc_calibrated_orig(t,i,kfo) = p15_kcal_pc_calibrated(t,i,kfo);
    p15_kcal_pc_calibrated(t,i,kfo) = p15_kcal_pc_calibrated_orig(t,i,kfo) * (1-i15_exo_foodscen_fader(t,i))
                        + i15_kcal_pc_scen_target(t,i,kfo) * i15_exo_foodscen_fader(t,i);
);
The calibration parameter is added to the regression value. The BMI shares are not allowed to exceed the bounds 0 and 1. Values are corrected to the bounds. In case that the bmi groups, due to calibration, exceed 1, we rescale to 1. The mismatch below one is balanced by moving the exceeding quantities into the middle BMI group. We recalculate the intake with the new values.
After each execution of the food demand model, the body height distribution of the population is estimated. The starting point is the body height distribution of the last timestep. The body height estimates of the old period are moved into the subsequent age class (e.g. the 20-24 year old are now 25-29 years old). The age class of 15-19 year old is estimated newly using the body height regressions and the food consumption of the last 15 years.
   p15_bodyheight(t,iso,sex,"15--19","final") =
                     f15_bodyheight_regr_paras(sex,"slope")*
                     (sum(underaged15,
                       p15_kcal_growth_food(t,iso,underaged15)
                     )/3)**f15_bodyheight_regr_paras(sex,"exponent")
                     ;
The bodyheight of the underaged age class (0-14) is assumed to diverge from ‘normal’ body height by the same proportion as the age class of the 15-19 year old.
p15_bodyheight(t,iso,"M","0--4","final")=p15_bodyheight(t,iso,"M","15--19","final")/176*92;
p15_bodyheight(t,iso,"M","5--9","final")=p15_bodyheight(t,iso,"M","15--19","final")/176*125;
p15_bodyheight(t,iso,"M","10--14","final")=p15_bodyheight(t,iso,"M","15--19","final")/176*152;
p15_bodyheight(t,iso,"F","0--4","final")=p15_bodyheight(t,iso,"M","15--19","final")/163*91;
p15_bodyheight(t,iso,"F","5--9","final")=p15_bodyheight(t,iso,"M","15--19","final")/163*124;
p15_bodyheight(t,iso,"F","10--14","final")=p15_bodyheight(t,iso,"M","15--19","final")/163*154;
Finally, the regression outcome is calibrated by a country-specific additive term, which is the residual of the regression fit and observation of the last historical time step.
if (sum(sameas(t_past,t),1) = 1,
  p15_bodyheight_calib(t,iso,sex,age_new_estimated15) = f15_bodyheight(t,iso,sex,age_new_estimated15) - p15_bodyheight(t,iso,sex,age_new_estimated15,"final");
  p15_bodyheight(t,iso,sex,age_new_estimated15,"final") = f15_bodyheight(t,iso,sex,age_new_estimated15);
else
  p15_bodyheight_calib(t,iso,sex,age_new_estimated15)=p15_bodyheight_calib(t-1,iso,sex,age_new_estimated15);
  p15_bodyheight(t,iso,sex,age_new_estimated15,"final")=p15_bodyheight(t,iso,sex,age_new_estimated15,"final")+p15_bodyheight_calib(t,iso,sex,age_new_estimated15)*s15_calibrate;
);
Limitations There are no known limitations.
| Description | Unit | A | |
|---|---|---|---|
| f15_bmi (sex, age, bmi_group15) |
Mean body mass index for each BMI group | \(kg/m2\) | x |
| f15_bmi_shr_paras (sex, agegroup15, bmi_tree15, paras_b15) |
BMI share regression parameters in USD05PPP or dimensionless | \(X\) | x |
| f15_bmi_shr_past (t_all, iso, age, sex, bmi_group15) |
Observed share of population belonging to a BMI group in the past | \(1\) | x |
| f15_bodyheight (t_all, iso, sex, age) |
Body height | \(cm/cap\) | x |
| f15_bodyheight_regr_paras (sex, paras_h15) |
Body height regression parameters | \(X\) | x |
| f15_calib_fsupply (i) |
Factor calibrating food supply as estimated from intake and FAO waste assumptions to FAO food supply | \(1\) | |
| f15_demand_paras (regr15, food_scen15, par15) |
Food regression parameters in USD05PPP or dimensionless | \(X\) | x |
| f15_food_substitution_fader (t_all, fadeoutscen15) |
Fader for food substitution scenarios | \(1\) | x |
| f15_household_balanceflow (t_all, i, kall, dm_ge_nr) |
Balance flow to take account of heterogeneous products and processes | \(10^6 tDM\) | x |
| f15_intake_EATLancet (t_scen15, iso, kcal_scen15, EAT_scen15, kfo) |
EAT Lancet scenarios for food specific intake | \(kcal/capita/day\) | x |
| f15_intake_pc_observed_iso (t_all, iso, sex, age) |
Observed per capita food intake in the past | \(kcal/captia/day\) | x |
| f15_kcal_calib_fadeout (t_all, calibscen15) |
Calibration fadeout factor | \(1\) | x |
| f15_kcal_pc_iso (t_all, iso, kfo) |
Observed per capita food supply in the past | \(kcal/cap/day\) | x |
| f15_milk_share_fadeout_india (t_all) |
Milk share India fadeout scenario | \(1\) | x |
| f15_nutrition_attributes (t_all, kall, nutrition) |
Nutrition attributes of food items dedicated for fooduse | \(10^6 kcal/tDM | t Protein/tDM\) | x |
| f15_overcons_FAOwaste (iso, kfo) |
Ratio between food calorie supply and food intake based on FAO food waste shares | \(1\) | x |
| f15_price_index (t_all) |
Food price index in initialization period | \(1\) | x |
| f15_prices_initial (kall) |
Food prices in initialization period | \(USD_{05MER}/t DM\) | x |
| f15_rum_share_fadeout (t_all, livst_fadeoutscen15) |
Ruminant share fadeout scenario | \(1\) | x |
| f15_rum_share_fadeout_india (t_all) |
Ruminant share fadeout scenario for India | \(1\) | x |
| f15_schofield (sex, age, paras_s15) |
Schofield equation parameters in kcal per capita per day or kcal per capita per day per weight | \(X\) | x |
| i15_alcohol_fadeout (t, iso) |
Alcohol fadeout share | \(1\) | x |
| i15_bmi_halfsat (sex, agegroup15, bmi_tree15) |
BMI share regression halfsaturation | \(1\) | x |
| i15_bmi_intercept (sex, agegroup15, bmi_tree15) |
BMI share regression intercept | \(1\) | x |
| i15_bmi_saturation (sex, agegroup15, bmi_tree15) |
BMI share regression saturation | \(1\) | x |
| i15_bmi_shr_calib (t, iso, sex, age, bmi_group15) |
Calibration parameters to meet historical BMI shares | \(1\) | x |
| i15_bmi_shr_calib_lastcalibyear (iso, sex, age, bmi_group15) |
Calibration parameters of the last year with historical observations | \(1\) | x |
| i15_dem_halfsat (iso, regr15) |
Food regression parameters halfsaturation | \(USD_{05PPP}/cap\) | x |
| i15_dem_intercept (iso, regr15) |
Food regression parameters intercept in kcal or as share | \(X\) | x |
| i15_dem_nonsat (iso, regr15) |
Food regression parameters nonsaturation | \(1\) | x |
| i15_dem_saturation (iso, regr15) |
Food regression parameters saturation in kcal or as share | \(X\) | x |
| i15_exo_foodscen_fader (t, iso) |
Fader that converges per capita food consumption to an exogenous diet scenario | \(1\) | x |
| i15_fish_fadeout (t, iso) |
Fish fadeout share | \(1\) | x |
| i15_intake_detailed_scen_target (t, iso, kfo) |
Target for food-specific per capita calorie intake according to an exogenous diet scenario | \(kcal/capita/day\) | x |
| i15_intake_EATLancet (iso, kfo) |
Food-specific per capita calorie intake according to EAT Lancet diet scenario | \(kcal/capita/day\) | x |
| i15_intake_EATLancet_all (iso, kcal_scen15, EAT_scen15, kfo) |
Food-specific per capita calorie intake according to various EAT Lancet diet scenarios | \(kcal/capita/day\) | x |
| i15_intake_scen_target (t, iso) |
Target for total per capita calorie intake according to an exogenous diet scenario | \(kcal/capita/day\) | x |
| i15_kcal_pc_scen_target (t, iso, kfo) |
Target for per capita food consumption according to an exogenous diet scenario | \(kcal/capita/day\) | x |
| i15_kcal_pregnancy (t, iso) |
Additional calorie requirements for pregnancy and lactation | \(kcal\) | x |
| i15_livestock_fadeout (t, iso) |
Livestock fadeout share | \(1\) | x |
| i15_livestock_fadeout_threshold (t, iso) |
Livestock fadeout share for threshold | \(1\) | x |
| i15_livestock_kcal_structure_iso (t, iso, kfo_ap) |
Share of single livestock products within total livestock products (corrected for future changes in shares) | \(1\) | x |
| i15_livestock_kcal_structure_iso_raw (t, iso, kfo_ap) |
Share of single livestock products within total livestock products (uncorrected for future changes in shares) | \(1\) | x |
| i15_milk_share_fadeout_india (t_all) |
Temporal fader of milk share in india (applied before food demand model) | \(1\) | x |
| i15_prices_initial_kcal (iso, kfo) |
Initial prices that capture the approximate level of prices in 1961-2010 | \(USD_{05PPP}/kcal\) | x |
| i15_processed_kcal_structure_iso | Share of single processed products within total processed food | \(1\) | x |
| i15_protein_to_kcal_ratio (t, kfo) |
protein-to-kcal ratio | \(g protein/kcal\) | x |
| i15_rum_share_fadeout (t_all, iso) |
Temporal fader of ruminant meat share (applied before food demand model) | \(1\) | x |
| i15_rumdairy_fadeout (t, iso) |
Ruminant meat and dairy fadeout share | \(1\) | x |
| i15_rumdairy_scp_fadeout (t, iso) |
Ruminant meat and dairy fadeout share to be replaced by SCP | \(1\) | x |
| i15_ruminant_fadeout (t, iso) |
Ruminant fadeout share | \(1\) | x |
| i15_staples_kcal_structure_iso (t, iso, kfo_st) |
Share of single staple products within total staples | \(1\) | x |
| o15_bmi_shr (t, iso, sex, age, bmi_group15) |
Calibrated estimates BMI share for population groups | \(1\) | |
| o15_kcal_intake_total (t, iso) |
Total food intake in a country | \(kcal/capita/day\) | |
| o15_kcal_regr_initial (t, iso, kfo) |
Uncalibrated per capita demand before price shock | \(kcal/capita/day\) | x |
| p15_balanceflow_kcal (t, i, kfo) |
Balance flow for mismatch between FAOSTAT and demand estimates | \(kcal/capita/day\) | x |
| p15_balanceflow_kcal_iso (t, iso, kfo) |
Balance flow for mismatch between FAOSTAT and demand estimates | \(kcal/capita/day\) | x |
| p15_balanceflow_kcal_lastcalibyear (iso, kfo) |
Balance flow of last historic time step for mismatch between FAOSTAT and demand estimates | \(kcal/capita/day\) | x |
| p15_bmi_shr_calibrated (t, iso, sex, age, bmi_group15) |
Calibrated estimates of BMI share for population groups | \(1\) | x |
| p15_bmi_shr_regr (t, iso, sex, age, bmi_group15) |
Uncalibrated regression estimates of BMI shares | \(1\) | x |
| p15_bmi_shr_target (t, iso, sex, age, bmi_group15) |
Target for BMI shares under exogenous scenarios | \(1\) | x |
| p15_bodyheight (t, iso, sex, age, estimates15) |
Body height | \(cm/cap\) | x |
| p15_bodyheight_calib (t, iso, sex, age_new_estimated15) |
Calibration factor for regional height differences | \(cm\) | x |
| p15_bodyweight (t, iso, sex, age, bmi_group15) |
Body weight | \(kg/cap\) | x |
| p15_convergence_measure (t, iter15) |
Convergence measure to decide for continuation or stop of food_demand - magpie iteration | \(1\) | x |
| p15_country_dummy (iso) |
Dummy parameter indicating whether country is affected by diet scenarios | \(1\) | x |
| p15_delta_income (t, i, iter15) |
Regional change in per capita income due to price shock on regional level | \(1\) | x |
| p15_demand2intake_ratio (t, iso) |
Ratio between food calorie demand and intake | \(kcal/kcal\) | x |
| p15_demand2intake_ratio_detail (t, iso, kfo) |
Food waste ratio by food group | \(kcal/kcal\) | x |
| p15_demand2intake_ratio_detail_preexo (t, iso, kfo) |
Food waste as outcome of regression | \(kcal/kcal\) | x |
| p15_demand2intake_ratio_ref (i) |
Ratio between food calorie demand and intake for the historical time step of EAT Lancet diets | \(1\) | |
| p15_demand2intake_ratio_scen (t, i) |
Ratio between food calorie demand and intake according to exogenous food waste scenario | \(1\) | |
| p15_foodscen_region_shr (t_all, i) |
Weighted share of region with regards to diet scenario of countries | \(1\) | |
| p15_foodwaste_growth (t, iso) |
Increase in food waste over time relative to the historical time step of EAT Lancet diets | \(1\) | x |
| p15_income_pc_real_ppp (t, i) |
Regional per capita income after price shock on regional level | \(USD_{05PPP}/capita\) | x |
| p15_intake (t, iso, sex, age, bmi_group15) |
Mean food intake by population group | \(kcal/capita/day\) | x |
| p15_intake_detail (t, iso, kfo) |
Intake by food group | \(kcal/capita/day\) | x |
| p15_intake_detailed_regr (t, i, kfo) |
Food-specific per capita calorie intake according to regression-based projections | \(kcal/capita/day\) | |
| p15_intake_total (t, iso) |
Total food intake in a country | \(kcal/capita/day\) | x |
| p15_intake_total_calibrated (t, i) |
Total regional food intake | \(kcal/capita/day\) | |
| p15_intake_total_iso_calibrated (t, iso) |
Total food intake in a country | \(kcal/capita/day\) | |
| p15_iteration_counter (t) |
Number of iterations required for reaching an equilibrium between food demand model and magpie | \(1\) | x |
| p15_kcal_calib (t, iso, kfo) |
Balance flow to diverge from mean calories of regressions | \(kcal/cap/day\) | x |
| p15_kcal_calib_lastcalibyear (iso, kfo) |
Calibration factor for the last year with observations | \(kcal/cap/day\) | x |
| p15_kcal_growth_food (t_all, iso, underaged15) |
Average per capita demand for body size growth relevant food items in the last three 5-year steps | \(kcal/capita/day\) | x |
| p15_kcal_pc (t, i, kfo) |
Per capita consumption in food demand model after price shock on regional level | \(kcal/capita/day\) | x |
| p15_kcal_pc_calibrated (t, i, kfo) |
Calibrated per capita consumption in food demand model after price shock | \(kcal/capita/day\) | x |
| p15_kcal_pc_calibrated_livestock_orig (t, i) |
Auxiliary parameter for per capita livestock consumption - basis for scenarios of livestock food substitution | \(kcal/capita/day\) | |
| p15_kcal_pc_calibrated_orig (t, i, kfo) |
Auxiliary parameter for per capita food consumption - basis for convergence into waste and diet scenarios | \(kcal/capita/day\) | |
| p15_kcal_pc_calibrated_plant_orig (t, i) |
Auxiliary parameter for per capita plant-based food consumption - basis for scenarios of livestock food substitution | \(kcal/capita/day\) | |
| p15_kcal_pc_calibrated_rumdairy_orig (t, i) |
Auxiliary parameter for per capita ruminant and dairy consumption - basis for scenarios of ruminant-based food substitution | \(kcal/capita/day\) | |
| p15_kcal_pc_initial (t, i, kfo) |
Per capita consumption in food demand model before price shock on regional level | \(kcal/capita/day\) | x |
| p15_kcal_pc_initial_iso (t, iso, kfo) |
Per capita consumption in food demand model before price shock on country level | \(kcal/capita/day\) | x |
| p15_kcal_pc_iso (t, iso, kfo) |
Per capita consumption in food demand model after price shock on country level | \(kcal/capita/day\) | x |
| p15_kcal_pc_iso_livestock_orig (t, iso) |
Auxiliary parameter for per capita livestock consumption - basis for scenarios of livestock food substitution | \(kcal/capita/day\) | x |
| p15_kcal_pc_iso_orig (t, iso, kfo) |
Auxiliary parameter for per capita food consumption - basis for convergence into waste and diet scenarios | \(kcal/capita/day\) | x |
| p15_kcal_pc_iso_plant_orig (t, iso) |
Auxiliary parameter for per capita plant-based food consumption - basis for scenarios of livestock food substitution | \(kcal/capita/day\) | x |
| p15_kcal_pc_iso_rumdairy_orig (t, iso) |
Auxiliary parameter for per capita ruminant and dairy consumption - basis for scenarios of ruminant-based food substitution | \(kcal/capita/day\) | x |
| p15_kcal_pc_livestock_supply_target (iso) |
Target of per capita livestock consumption | \(kcal/capita/day\) | x |
| p15_kcal_regr (t, iso, kfo) |
Uncalibrated regression estimates of calorie demand | \(kcal/cap/day\) | x |
| p15_livestock_kcal_structure_orig (t, iso, kfo_lp) |
Auxiliary parameter for livestock kcal structure - basis for scenarios of livestock food substitution | \(1\) | x |
| p15_modelstat (t) |
Model solver status | \(1\) | x |
| p15_physical_activity_level (t, iso, sex, age) |
Physical activity levels in PAL relative to basic metabolic rate BMR | \(kcal/kcal\) | x |
| p15_plant_kcal_structure_orig (t, iso, kfo_pp) |
Auxiliary parameter for plant-based food kcal structure - basis for scenarios of livestock food substitution | \(1\) | x |
| p15_prices_kcal (t, iso, kfo, iter15) |
Prices from MAgPIE after optimization | \(USD_{05PPP}/kcal\) | x |
| p15_rumdairy_kcal_structure_orig (t, iso, kfo_rd) |
Auxiliary parameter for ruminant and dairy kcal structure - basis for scenarios of ruminant-based food substitution | \(1\) | x |
| p15_waste_pc (t, iso, kfo) |
Household waste by food group | \(kcal/capita/day\) | x |
| q15_aim | Objective function of food demand model | \(10^6 USD_{05PPP}\) | x |
| q15_bmi_shr_agg (iso, sex, age, bmi_group15) |
Disaggregates age groups from overarching groups | \(1\) | x |
| q15_bmi_shr_high (iso, sex, agegroup15) |
Estimates BMI share for population groups with high BMI | \(1\) | x |
| q15_bmi_shr_low (iso, sex, agegroup15) |
Estimates BMI share for population groups with very low BMI | \(1\) | x |
| q15_bmi_shr_medium (iso, sex, agegroup15) |
Estimates BMI share for population groups with medium BMI(1) | x | |
| q15_bmi_shr_medium_high (iso, sex, agegroup15) |
Estimates BMI share for population groups with medium to high BMI | \(1\) | x |
| q15_bmi_shr_veryhigh (iso, sex, agegroup15) |
Estimates BMI share for population groups with very high BMI | \(1\) | x |
| q15_bmi_shr_verylow (iso, sex, agegroup15) |
Estimates BMI share for population groups with low BMI | \(1\) | x |
| q15_budget (iso) |
Household budget constraint | \(USD_{05PPP}/cap/day\) | x |
| q15_food_demand (i, kfo) |
Food demand | \(10^6 kcal\) | x |
| q15_foodtree_kcal_animals (iso, kfo_ap) |
Demand for animal products | \(kcal/cap/day\) | x |
| q15_foodtree_kcal_processed (iso, kfo_pf) |
Demand for processed products | \(kcal/cap/day\) | x |
| q15_foodtree_kcal_staples (iso, kfo_st) |
Demand for staple products | \(kcal/cap/day\) | x |
| q15_foodtree_kcal_vegetables (iso) |
Demand for vegetable and fruit products | \(kcal/cap/day\) | x |
| q15_intake (iso) |
Estimates average intake for the entire country | \(kcal/cap/day\) | x |
| q15_regr (iso, regr15) |
Estimates parameters for food demand and dietary composition | \(1\) | x |
| q15_regr_bmi_shr (iso, sex, agegroup15, bmi_tree15) |
Estimates regression parameters for BMI regression shares | \(1\) | x |
| q15_regr_kcal (iso) |
Per capita total demand | \(kcal/cap/day\) | x |
| s15_alc_scen | Scenario target for the inclusion of alcohol in the EAT-Lancet diet | \(1\) | x |
| s15_calibrate | Calibration switch (1=calibrated 0=pure regression outcomes) | \(1\) | x |
| s15_convergence | Convergence criterion | \(1\) | x |
| s15_count | Loop counter for interpolating body height estimates between longer timesteps | \(1\) | x |
| s15_elastic_demand | Elastic demand switch (1=elastic 0=exogenous) | \(1\) | x |
| s15_exo_alcohol | Exogenous alcohol target on | \(1\) | x |
| s15_exo_brans | Exogenous brans | \(1\) | x |
| s15_exo_diet | Switch for transition towards exogenous diet scenario | \(1\) | x |
| s15_exo_fish | Exogenous EAT Lancet animal product target on | \(1\) | x |
| s15_exo_fruitvegnut | Exogenous EAT Lancet fruit vegetable nut seeds target on | \(1\) | x |
| s15_exo_monogastric | Exogenous EAT Lancet animal product target on | \(1\) | x |
| s15_exo_oils | Exogenous oils | \(1\) | x |
| s15_exo_pulses | Exogenous pulses target on | \(1\) | x |
| s15_exo_ruminant | Exogenous EAT Lancet animal product target on | \(1\) | x |
| s15_exo_scp | Exogenous microbial protein target on | \(1\) | x |
| s15_exo_sugar | Exogenous sugar target on | \(1\) | x |
| s15_exo_waste | Switch for transition towards exogenous food waste scenario | \(1\) | x |
| s15_kcal_pc_livestock_intake_target | target for livestock intake | \(kcal/cap/day\) | x |
| s15_livescen_target_subst | fade-out of livestock products (0) or substitution of livestock products with plant-based products | \(1\) | x |
| s15_maxiter | Scalar defining maximum number of iterations | \(1\) | x |
| s15_milk_share_fadeout_india | switch for milk fadeout in India | \(binary\) | x |
| s15_rum_share_fadeout_india_strong | switch for stronger ruminant fadeout in India | \(binary\) | x |
| s15_run_diet_postprocessing | run diet postprocessing | \(1\) | x |
| s15_waste_scen | Scenario target for the ratio between food demand and intake | \(1\) | x |
| s15_year | Current year as integer value | \(yr\) | x |
| s15_yeardiff | Number of 5-year time intervalls between time steps | \(1\) | x |
| v15_bmi_shr_overgroups (iso, sex, agegroup15, bmi_group15) |
Uncalibrated share of population groups belonging to a certain BMI group | \(1\) | x |
| v15_bmi_shr_regr (iso, sex, age, bmi_group15) |
Uncalibrated share of population groups belonging to a certain BMI group | \(1\) | x |
| v15_demand_regr (iso, regr15) |
Uncalibrated regression estimates of kcal shares | \(1\) | x |
| v15_income_balance (iso) |
Balance variable to balance cases in which reduction in income is larger than the per capita GDP | \(USD_{05PPP}/cap/yr\) | x |
| v15_income_pc_real_ppp_iso (iso) |
Real income per cap | \(USD_{05PPP}/cap\) | x |
| v15_kcal_intake_total_regr (iso) |
Food intake | \(kcal/cap/day\) | x |
| v15_kcal_regr (iso, kfo) |
Uncalibrated regression estimates of calorie demand | \(kcal/cap/day\) | x |
| v15_kcal_regr_total (iso) |
Uncalibrated regression estimates of total per cap calories | \(kcal/cap/day\) | x |
| v15_objective | Objective term | \(USD_{05PPP}\) | x |
| v15_regr_overgroups (iso, sex, agegroup15, bmi_tree15) |
Hierarchical tree parameter regressions | \(1\) | x |
| B | |
|---|---|
| f15_bmi (sex, age, bmi_group15) |
x |
| f15_bmi_shr_paras (sex, agegroup15, bmi_tree15, paras_b15) |
x |
| f15_bmi_shr_past (t_all, iso, age, sex, bmi_group15) |
x |
| f15_bodyheight (t_all, iso, sex, age) |
x |
| f15_bodyheight_regr_paras (sex, paras_h15) |
x |
| f15_calib_fsupply (i) |
x |
| f15_demand_paras (regr15, food_scen15, par15) |
x |
| f15_food_substitution_fader (t_all, fadeoutscen15) |
x |
| f15_household_balanceflow (t_all, i, kall, dm_ge_nr) |
x |
| f15_intake_EATLancet (t_scen15, iso, kcal_scen15, EAT_scen15, kfo) |
x |
| f15_intake_pc_observed_iso (t_all, iso, sex, age) |
x |
| f15_kcal_calib_fadeout (t_all, calibscen15) |
x |
| f15_kcal_pc_iso (t_all, iso, kfo) |
x |
| f15_milk_share_fadeout_india (t_all) |
x |
| f15_nutrition_attributes (t_all, kall, nutrition) |
x |
| f15_overcons_FAOwaste (iso, kfo) |
x |
| f15_price_index (t_all) |
x |
| f15_prices_initial (kall) |
x |
| f15_rum_share_fadeout (t_all, livst_fadeoutscen15) |
x |
| f15_rum_share_fadeout_india (t_all) |
x |
| f15_schofield (sex, age, paras_s15) |
x |
| i15_alcohol_fadeout (t, iso) |
x |
| i15_bmi_halfsat (sex, agegroup15, bmi_tree15) |
x |
| i15_bmi_intercept (sex, agegroup15, bmi_tree15) |
x |
| i15_bmi_saturation (sex, agegroup15, bmi_tree15) |
x |
| i15_bmi_shr_calib (t, iso, sex, age, bmi_group15) |
x |
| i15_bmi_shr_calib_lastcalibyear (iso, sex, age, bmi_group15) |
x |
| i15_dem_halfsat (iso, regr15) |
x |
| i15_dem_intercept (iso, regr15) |
x |
| i15_dem_nonsat (iso, regr15) |
x |
| i15_dem_saturation (iso, regr15) |
x |
| i15_exo_foodscen_fader (t, iso) |
x |
| i15_fish_fadeout (t, iso) |
x |
| i15_intake_detailed_scen_target (t, iso, kfo) |
x |
| i15_intake_EATLancet (iso, kfo) |
x |
| i15_intake_EATLancet_all (iso, kcal_scen15, EAT_scen15, kfo) |
x |
| i15_intake_scen_target (t, iso) |
x |
| i15_kcal_pc_scen_target (t, iso, kfo) |
x |
| i15_kcal_pregnancy (t, iso) |
x |
| i15_livestock_fadeout (t, iso) |
x |
| i15_livestock_fadeout_threshold (t, iso) |
x |
| i15_livestock_kcal_structure_iso (t, iso, kfo_ap) |
x |
| i15_livestock_kcal_structure_iso_raw (t, iso, kfo_ap) |
x |
| i15_milk_share_fadeout_india (t_all) |
x |
| i15_prices_initial_kcal (iso, kfo) |
x |
| i15_processed_kcal_structure_iso | x |
| i15_protein_to_kcal_ratio (t, kfo) |
x |
| i15_rum_share_fadeout (t_all, iso) |
x |
| i15_rumdairy_fadeout (t, iso) |
x |
| i15_rumdairy_scp_fadeout (t, iso) |
x |
| i15_ruminant_fadeout (t, iso) |
x |
| i15_staples_kcal_structure_iso (t, iso, kfo_st) |
x |
| o15_bmi_shr (t, iso, sex, age, bmi_group15) |
x |
| o15_kcal_intake_total (t, iso) |
x |
| o15_kcal_regr_initial (t, iso, kfo) |
x |
| p15_balanceflow_kcal (t, i, kfo) |
x |
| p15_balanceflow_kcal_iso (t, iso, kfo) |
x |
| p15_balanceflow_kcal_lastcalibyear (iso, kfo) |
x |
| p15_bmi_shr_calibrated (t, iso, sex, age, bmi_group15) |
x |
| p15_bmi_shr_regr (t, iso, sex, age, bmi_group15) |
x |
| p15_bmi_shr_target (t, iso, sex, age, bmi_group15) |
|
| p15_bodyheight (t, iso, sex, age, estimates15) |
x |
| p15_bodyheight_calib (t, iso, sex, age_new_estimated15) |
x |
| p15_bodyweight (t, iso, sex, age, bmi_group15) |
x |
| p15_convergence_measure (t, iter15) |
x |
| p15_country_dummy (iso) |
x |
| p15_delta_income (t, i, iter15) |
x |
| p15_demand2intake_ratio (t, iso) |
x |
| p15_demand2intake_ratio_detail (t, iso, kfo) |
|
| p15_demand2intake_ratio_detail_preexo (t, iso, kfo) |
|
| p15_demand2intake_ratio_ref (i) |
x |
| p15_demand2intake_ratio_scen (t, i) |
x |
| p15_foodscen_region_shr (t_all, i) |
x |
| p15_foodwaste_growth (t, iso) |
x |
| p15_income_pc_real_ppp (t, i) |
x |
| p15_intake (t, iso, sex, age, bmi_group15) |
x |
| p15_intake_detail (t, iso, kfo) |
|
| p15_intake_detailed_regr (t, i, kfo) |
x |
| p15_intake_total (t, iso) |
|
| p15_intake_total_calibrated (t, i) |
x |
| p15_intake_total_iso_calibrated (t, iso) |
x |
| p15_iteration_counter (t) |
x |
| p15_kcal_calib (t, iso, kfo) |
x |
| p15_kcal_calib_lastcalibyear (iso, kfo) |
x |
| p15_kcal_growth_food (t_all, iso, underaged15) |
x |
| p15_kcal_pc (t, i, kfo) |
x |
| p15_kcal_pc_calibrated (t, i, kfo) |
x |
| p15_kcal_pc_calibrated_livestock_orig (t, i) |
x |
| p15_kcal_pc_calibrated_orig (t, i, kfo) |
x |
| p15_kcal_pc_calibrated_plant_orig (t, i) |
x |
| p15_kcal_pc_calibrated_rumdairy_orig (t, i) |
x |
| p15_kcal_pc_initial (t, i, kfo) |
x |
| p15_kcal_pc_initial_iso (t, iso, kfo) |
x |
| p15_kcal_pc_iso (t, iso, kfo) |
x |
| p15_kcal_pc_iso_livestock_orig (t, iso) |
|
| p15_kcal_pc_iso_orig (t, iso, kfo) |
|
| p15_kcal_pc_iso_plant_orig (t, iso) |
|
| p15_kcal_pc_iso_rumdairy_orig (t, iso) |
|
| p15_kcal_pc_livestock_supply_target (iso) |
x |
| p15_kcal_regr (t, iso, kfo) |
x |
| p15_livestock_kcal_structure_orig (t, iso, kfo_lp) |
x |
| p15_modelstat (t) |
x |
| p15_physical_activity_level (t, iso, sex, age) |
x |
| p15_plant_kcal_structure_orig (t, iso, kfo_pp) |
x |
| p15_prices_kcal (t, iso, kfo, iter15) |
x |
| p15_rumdairy_kcal_structure_orig (t, iso, kfo_rd) |
x |
| p15_waste_pc (t, iso, kfo) |
|
| q15_aim | x |
| q15_bmi_shr_agg (iso, sex, age, bmi_group15) |
x |
| q15_bmi_shr_high (iso, sex, agegroup15) |
x |
| q15_bmi_shr_low (iso, sex, agegroup15) |
x |
| q15_bmi_shr_medium (iso, sex, agegroup15) |
x |
| q15_bmi_shr_medium_high (iso, sex, agegroup15) |
x |
| q15_bmi_shr_veryhigh (iso, sex, agegroup15) |
x |
| q15_bmi_shr_verylow (iso, sex, agegroup15) |
x |
| q15_budget (iso) |
x |
| q15_food_demand (i, kfo) |
x |
| q15_foodtree_kcal_animals (iso, kfo_ap) |
x |
| q15_foodtree_kcal_processed (iso, kfo_pf) |
x |
| q15_foodtree_kcal_staples (iso, kfo_st) |
x |
| q15_foodtree_kcal_vegetables (iso) |
x |
| q15_intake (iso) |
x |
| q15_regr (iso, regr15) |
x |
| q15_regr_bmi_shr (iso, sex, agegroup15, bmi_tree15) |
x |
| q15_regr_kcal (iso) |
x |
| s15_alc_scen | x |
| s15_calibrate | x |
| s15_convergence | x |
| s15_count | x |
| s15_elastic_demand | x |
| s15_exo_alcohol | |
| s15_exo_brans | |
| s15_exo_diet | x |
| s15_exo_fish | |
| s15_exo_fruitvegnut | |
| s15_exo_monogastric | |
| s15_exo_oils | |
| s15_exo_pulses | |
| s15_exo_ruminant | |
| s15_exo_scp | |
| s15_exo_sugar | |
| s15_exo_waste | x |
| s15_kcal_pc_livestock_intake_target | x |
| s15_livescen_target_subst | x |
| s15_maxiter | x |
| s15_milk_share_fadeout_india | x |
| s15_rum_share_fadeout_india_strong | x |
| s15_run_diet_postprocessing | |
| s15_waste_scen | x |
| s15_year | x |
| s15_yeardiff | x |
| v15_bmi_shr_overgroups (iso, sex, agegroup15, bmi_group15) |
x |
| v15_bmi_shr_regr (iso, sex, age, bmi_group15) |
x |
| v15_demand_regr (iso, regr15) |
x |
| v15_income_balance (iso) |
x |
| v15_income_pc_real_ppp_iso (iso) |
x |
| v15_kcal_intake_total_regr (iso) |
x |
| v15_kcal_regr (iso, kfo) |
x |
| v15_kcal_regr_total (iso) |
x |
| v15_objective | x |
| v15_regr_overgroups (iso, sex, agegroup15, bmi_tree15) |
x |
| description | |
|---|---|
| adult15(age) | Age groups for adult population |
| age | Population age groups |
| age_new_estimated15(age) | Estimated ages |
| age2_adults15(agegroup15) | Adult age group |
| agegroup15 | All age groups |
| agegroup2age(agegroup15, age) | Mapping between age cohort and age |
| attributes | Product attributes characterizing a product (such as weight or energy content) |
| bmi_group_est15(bmi_group15) | Body mass index extremes |
| bmi_group15 | Body mass index gradient |
| bmi_tree15 | Body mass index |
| calibscen15 | Calibration scenarios for balance flow |
| ct(t) | Current time period |
| curr_iter15(iter15) | currently active iteration |
| dm_ge_nr(nutrients) | Attribtues relevant for nutrition |
| EAT_fruitvegnutseed15(kfo) | vegetables fruits nuts seeds |
| EAT_monogastrics15(kfo) | monogastic products |
| EAT_nonstaples(kfo) | All non-staple food products according to EAT Lancet definition |
| EAT_pulses15(kfo) | pulses |
| EAT_ruminants15(kfo) | ruminant products |
| EAT_scen15 | Scenario of daily per capita calorie intake |
| EAT_staples(kfo) | All staple food products according to EAT Lancet definition |
| EAT_sugar15(kfo) | sugar |
| estimates15 | Preliminary or final result for body height distribution |
| fadeoutscen15 | Food substitution scenarios including functional forms with targets and transition periods |
| food_scen15 | Food scenarios |
| growth_food15(kfo) | Food items that are important for body growth regression |
| i | all economic regions |
| i_to_iso(i, iso) | mapping regions to iso countries |
| i2(i) | World regions (dynamic set) |
| iso | list of iso countries |
| iter15 | iterations between food demand model and magpie |
| kall | All products in the sectoral version |
| kcal_scen15 | Scenario of daily per capita calorie intake |
| kfo_ap(kfo) | Animal food products |
| kfo_lp(kfo) | Livestock food products |
| kfo_pf(kfo) | Processed foods including oils sugar alcohol |
| kfo_pp(kfo) | Plant-based food products |
| kfo_rd(kfo) | Ruminant meat and dairy food products |
| kfo_st(kfo) | Staple products |
| kfo(kall) | All products in the sectoral version |
| knf(kall) | Non-food products in the sectoral version |
| kst(kfo) | Plant-based staple products in the sectoral version |
| livst_fadeoutscen15 | Scenarios for changed composition of livestock products |
| nutrition | Nutrition attributes |
| par15 | Parameters for food module |
| paras_b15 | Intake equation parameters |
| paras_h15 | Bodyheight equation parameters |
| paras_s15 | Schofield equation parameters |
| pop_scen15 | Population scenarios |
| prev_iter15(iter15) | last active iteration |
| regr15 | Demand regression types |
| reproductive(age) | Age group of people in the reproductive age |
| retired15(adult15) | Age group of retired population |
| scen_countries15(iso) | countries to be affected by selected food sceanrio |
| sex | Sex groups |
| t_all(t_ext) | 5-year time periods |
| t_past(t_all) | Timesteps with observed data |
| t_scen15(t_all) | Target years for transition to exogenous scenario diets |
| t(t_all) | Simulated time periods |
| type | GAMS variable attribute used for the output |
| underaged15(age) | Group of underaged age classes |
| working15(adult15) | Group of working age population |
Benjamin Leon Bodirsky, Isabelle Weindl, Jan Philipp Dietrich
09_drivers, 16_demand, 20_processing, 62_material, 70_livestock
Bodirsky, Benjamin Leon, Jan Philipp Dietrich, Eleonora Martinelli, Antonia Stenstad, Prajal Pradhan, Sabine Gabrysch, Abhijeet Mishra, et al. 2020. “The Ongoing Nutrition Transition Thwarts Long-Term Targets for Food Security, Public Health and Environmental Protection.” Scientific Reports 10 (1): 19778. https://doi.org/10.1038/s41598-020-75213-3.
Willett, Walter, Johan Rockström, Brent Loken, Marco Springmann, Tim Lang, Sonja Vermeulen, Tara Garnett, et al. 2019. “Food in the Anthropocene: The EAT–Lancet Commission on Healthy Diets from Sustainable Food Systems.” The Lancet, January. https://doi.org/10.1016/S0140-6736(18)31788-4.