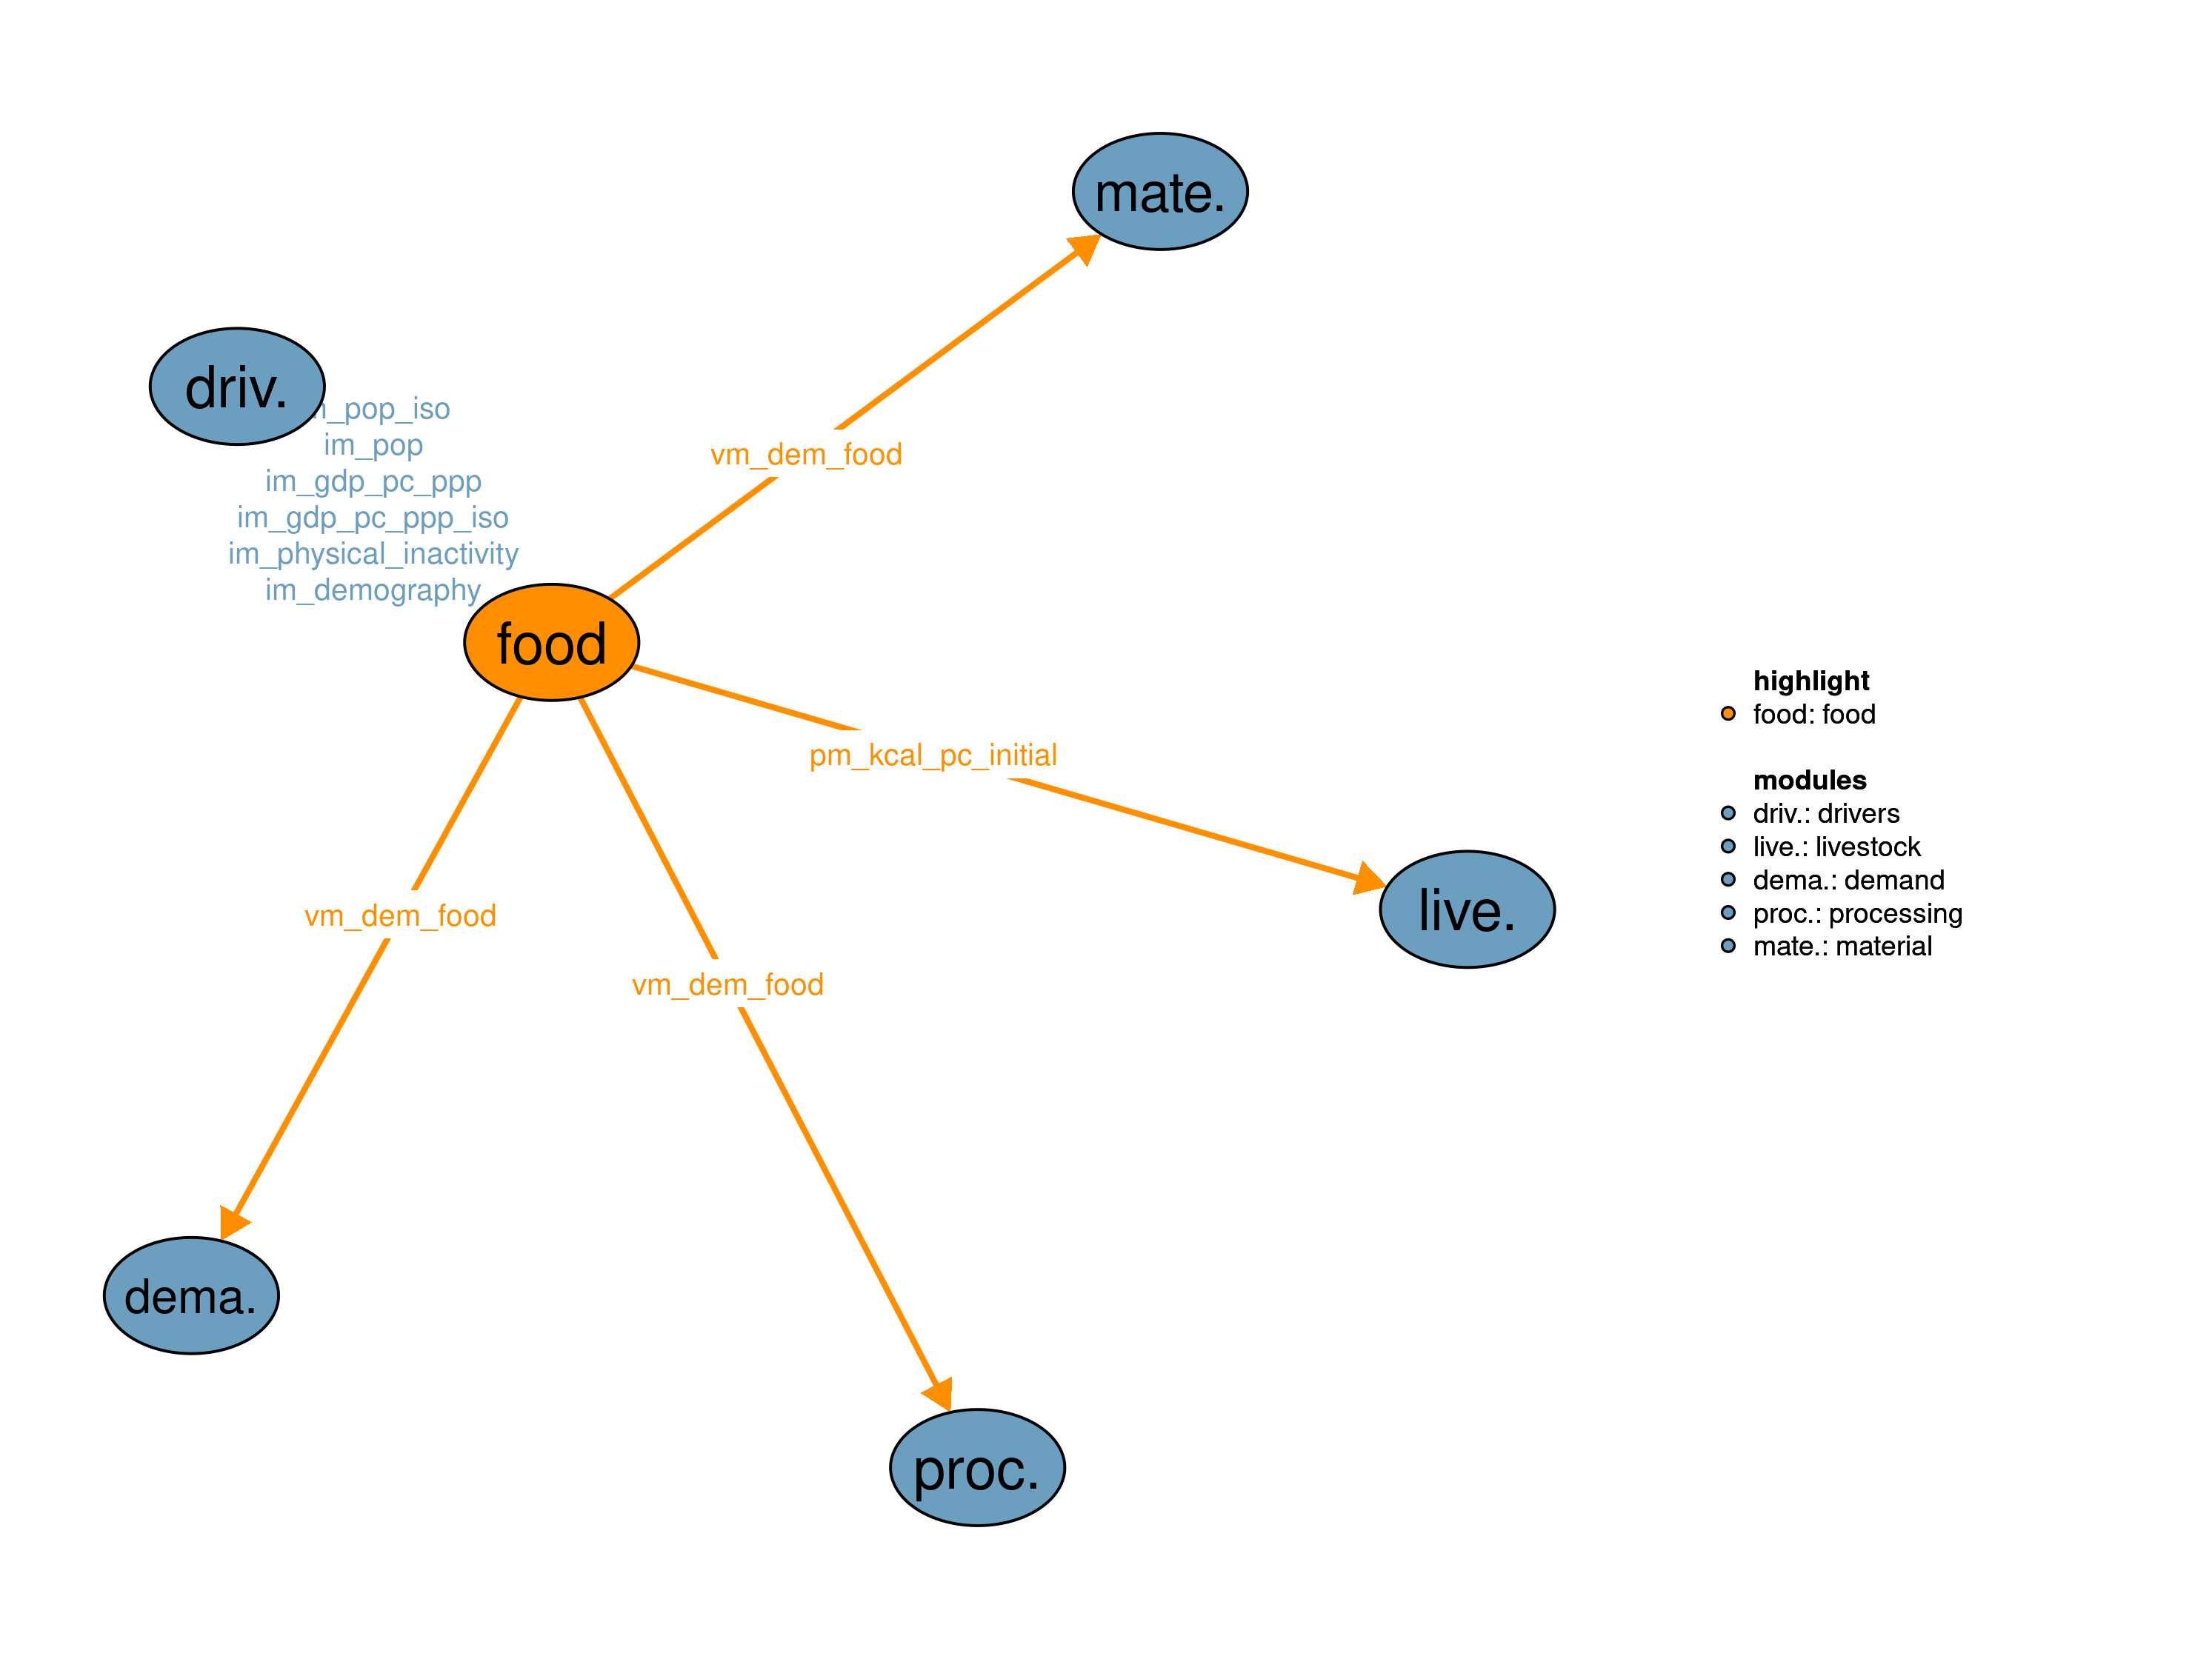
The main function of the food demand module is to forecast the food demand from agricultural products, which is used in the module 16_demand.
| Description | Unit | A | |
|---|---|---|---|
| im_demography (t, iso, sex, age) |
Population by groups | \(10^6/yr\) | x |
| im_gdp_pc_ppp (t, i) |
Per capita income in purchasing power parity | \(USD_{05PPP}/cap/yr\) | x |
| im_gdp_pc_ppp_iso (t, iso) |
Per capita income in purchasing power parity | \(USD_{05PPP}/cap/yr\) | x |
| im_physical_inactivity (t, iso, sex, age) |
Share of population which is physically inactive | \(1\) | x |
| im_pop (t, i) |
Population | \(10^6/yr\) | x |
| im_pop_iso (t, iso) |
Population | \(10^6/yr\) | x |
| sm_intersolve | if 0 finish loop or if 1 iterate optimization | \(1\) | x |
| Description | Unit | |
|---|---|---|
| pm_kcal_pc_initial (t, i, kfo) |
Per capita consumption in food demand model before price shock | \(kcal/capita/day\) |
| vm_dem_food (i, kall) |
Food demand | \(10^6 tDM/yr\) |
The realization anthropometrics_jan18 uses per capita income and the demography of the world population (including sex and age classes at the country level, which are provided from module 09_drivers) as drivers. The module estimates food demand on iso-country level taking anthropometric food requirements as well as economic dynamics into account. If flexible demand is activated, the module also uses the shadow prices for agircultural products from the optimization, which are the Lagrange multipliers of the constraint q15_food_demand. The module consists of a standalone food demand model, which is executed before MAgPIE starts. In the case of endogenous demand, the module is iterated with MAgPIE. Besides providing the fooduse of agricultural products, the model also provides a number of output indicators, including the BMI distribution, body weight and height of the population by age and sex, food intake by age group and sex, food waste, dietary composition between livestock products, empty calories (sugar, oil and alcohol), fruits vegetables and nuts, as well as staple calories. The food demand model can be run in standalone mode by running the the file standalone/demand_model.gms. The model is described in (Bodirsky et al., n.d.)
The food demand model consists of the following equations, which are not part of MAgPIE.
model m15_food_demand /
      q15_aim,
      q15_budget,
      q15_regr_bmi_shr,
      q15_bmi_shr_verylow,
      q15_bmi_shr_low,
      q15_bmi_shr_medium,
      q15_bmi_shr_medium_high,
      q15_bmi_shr_high,
      q15_bmi_shr_veryhigh,
      q15_bmi_shr_agg,
      q15_intake,
      q15_regr_kcal,
      q15_regr,
      q15_foodtree_kcal_animals,
      q15_foodtree_kcal_processed,
      q15_foodtree_kcal_staples,
      q15_foodtree_kcal_vegetables
  /;
In contrast, the equation q15_food_demand is part of MAgPIE, but not of the food demand model.
\[\begin{multline*} \left(vm\_dem\_food(i2,kfo) + \sum_{ct} f15\_household\_balanceflow(ct,i2,kfo,"dm")\right) \cdot \sum_{ct}\left(f15\_nutrition\_attributes(ct,kfo,"kcal") \cdot 10^{6}\right) \geq \sum_{ct}\left(im\_pop(ct,i2) \cdot p15\_kcal\_pc\_calibrated(ct,i2,kfo)\right) \cdot 365 \end{multline*}\]
Above constraint transforms the fooduse of agricultural products into per capita food demand. vm_dem_food is the fooduse of agricultural products. It is measured in tons of dry matter prior to processing. The multiplication with the nutrition attributes provides the equivalent in calories. While nutrition attributes are assumed to be globally the same (assumption of homogeneous products), a regional balance flow is used to account for current differences in food processing, where some regions get different calories from the same fooduse quantitiy. Depending on the input data, the balance flow may fade out in the future, which implies actual homogeneous products. The subsequent equations belong to the standalone food demand model, which is executed before MAgPIE or iterated with MAgPIE. They are excluded from the run of MAgPIE itself.
\[\begin{multline*} v15\_objective = \sum_{iso}\left( - 10^{6} \cdot v15\_income\_balance(iso)\right) \end{multline*}\]
In principle, the food demand model has only one solution that satifies all equations. Technically, the objective could therefore be chosen arbirtrarily, for the solver to find the single solution. However, if the model is executed outside its domain (e.g. with extreme price shocks), it can happen that real income takes a negative value (because the increase in food value exceeds the available income). To avoid this case, a punishment term v15_income_balance is introduced. It increases the real income, but affects the maximized objective variable negatively, disincentivizing its use in cases where it is not needed.
\[\begin{multline*} v15\_income\_pc\_real\_ppp\_iso(iso) = \sum_{ct,kfo}\left( v15\_kcal\_regr(iso,kfo) \cdot 365 \cdot \left(i15\_prices\_initial\_kcal(iso,kfo)-p15\_prices\_kcal(ct,iso,kfo)\right)\right) + \sum_{ct}im\_gdp\_pc\_ppp\_iso(ct,iso) + v15\_income\_balance(iso) \end{multline*}\]
The budget constraint calculates the real income after a possible price shock. The basic assumption is that increasing prices reduce real income, while decreasing prices increase real income. Through this income effect, higher prices reduce the food demand. The income before the food price shock is im_gdp_pc_ppp. It is reduced by the change in value of the demanded calories under changed prices. In the following, the real income is used to determine food intake, food demand as well as dietary composition. The BMI distribution within the population is calculated using regressions in a hierachical tree to estimate the share of the population falling into a certain BMI class.  First, the regression shares are calculated:
\[\begin{multline*} v15\_regr\_overgroups(iso,sex,agegroup15,bmi\_tree15) = i15\_bmi\_intercept(sex,agegroup15,bmi\_tree15) +\frac{ \left(i15\_bmi\_saturation(sex,agegroup15,bmi\_tree15) \cdot v15\_income\_pc\_real\_ppp\_iso(iso)\right) }{ \left(i15\_bmi\_halfsat(sex,agegroup15,bmi\_tree15) + v15\_income\_pc\_real\_ppp\_iso(iso)\right)} \end{multline*}\]
Then, these regression shares are applied to parameterize the hierarchical tree structure:
\[\begin{multline*} v15\_bmi\_shr\_overgroups(iso,sex,agegroup15,"verylow") = v15\_regr\_overgroups(iso,sex,agegroup15,"low") \cdot v15\_regr\_overgroups(iso,sex,agegroup15,"lowsplit") \end{multline*}\]
\[\begin{multline*} v15\_bmi\_shr\_overgroups(iso,sex,agegroup15,"low") = v15\_regr\_overgroups(iso,sex,agegroup15,"low") \cdot \left(1- v15\_regr\_overgroups(iso,sex,agegroup15,"lowsplit")\right) \end{multline*}\]
\[\begin{multline*} v15\_bmi\_shr\_overgroups(iso,sex,agegroup15,"medium") = \left(1-v15\_regr\_overgroups(iso,sex,agegroup15,"low") -v15\_regr\_overgroups(iso,sex,agegroup15,"high")\right) \cdot \left(1-v15\_regr\_overgroups(iso,sex,agegroup15,"mediumsplit")\right) \end{multline*}\]
\[\begin{multline*} v15\_bmi\_shr\_overgroups(iso,sex,agegroup15,"mediumhigh") = \left(1-v15\_regr\_overgroups(iso,sex,agegroup15,"low") -v15\_regr\_overgroups(iso,sex,agegroup15,"high")\right) \cdot v15\_regr\_overgroups(iso,sex,agegroup15,"mediumsplit") \end{multline*}\]
\[\begin{multline*} v15\_bmi\_shr\_overgroups(iso,sex,agegroup15,"high") = v15\_regr\_overgroups(iso,sex,agegroup15,"high") \cdot \left(1-v15\_regr\_overgroups(iso,sex,agegroup15,"highsplit")\right) \end{multline*}\]
\[\begin{multline*} v15\_bmi\_shr\_overgroups(iso,sex,agegroup15,"veryhigh") = v15\_regr\_overgroups(iso,sex,agegroup15,"high") \cdot v15\_regr\_overgroups(iso,sex,agegroup15,"highsplit") \end{multline*}\]
From BMI shares of the larger groups (overgroups), we disaggregate to age-specific subgroups.
\[\begin{multline*} v15\_bmi\_shr\_regr(iso,sex,age,bmi\_group15) = \sum_{agegroup2age(agegroup15,age)}\left( v15\_bmi\_shr\_overgroups(iso,sex,agegroup15,bmi\_group15) \right) \end{multline*}\]
Food intake is estimated based on BMI distribution, typical intakes for BMI groups, demographic structure and extra energy requirements for pregnancy and lactation (estimated based on the new-born population size).
\[\begin{multline*} v15\_kcal\_intake\_total\_regr(iso) \cdot \sum_{sex,age,ct} im\_demography(ct,iso,sex,age) = \sum_{ct, sex, age, bmi\_group15}\left( v15\_bmi\_shr\_regr(iso,sex,age,bmi\_group15) \cdot im\_demography(ct,iso,sex,age) \cdot i15\_intake(ct,iso,sex,age,bmi\_group15) \right) + \sum_{ct}i15\_kcal\_pregnancy(ct,iso) \end{multline*}\]
Food demand is based on food intake and a regression based on income, which estimates how much the actual demand is relative to the required intake. The difference between demand and intake is food waste (not explicitly mentioned in this equation)
\[\begin{multline*} v15\_kcal\_regr\_total(iso) = v15\_demand\_regr\left(iso, "overconsumption"\right) \cdot v15\_kcal\_intake\_total\_regr(iso) \end{multline*}\]
This equation estimates key dietary composition regressision factors, such as the share of animal products, empty calories, or fruits, vegetables and nuts.
\[\begin{multline*} v15\_demand\_regr\left(iso, regr15\right) = i15\_dem\_intercept(regr15) +\frac{ \left(i15\_dem\_saturation(regr15) \cdot v15\_income\_pc\_real\_ppp\_iso(iso)\right) }{ \left(i15\_dem\_halfsat(regr15) + v15\_income\_pc\_real\_ppp\_iso(iso)^{i15\_dem\_nonsat(regr15)}\right)} \end{multline*}\]
In the subsequent equations, those parameters are used to determine the dietary composition using a hierachical tree: Total calories are first divided into animal- and plant-based. The plant-based calories are further divided into processed empty calories and nutritious calories, and so on.
\[\begin{multline*} v15\_kcal\_regr(iso,kfo\_ap) = v15\_kcal\_regr\_total(iso) \cdot v15\_demand\_regr\left(iso, "livestockshare"\right) \cdot \sum_{ct}i15\_livestock\_kcal\_structure\_iso(ct,iso,kfo\_ap) \end{multline*}\]
\[\begin{multline*} v15\_kcal\_regr(iso,kfo\_pf) = v15\_kcal\_regr\_total(iso) \cdot \left(1 - v15\_demand\_regr\left(iso, "livestockshare"\right)\right) \cdot v15\_demand\_regr\left(iso, "processedshare"\right) \cdot \sum_{ct}i15\_processed\_kcal\_structure\_iso(ct,iso,kfo\_pf) \end{multline*}\]
\[\begin{multline*} v15\_kcal\_regr(iso,"others") = v15\_kcal\_regr\_total(iso) \cdot \left(1 - v15\_demand\_regr\left(iso, "livestockshare"\right)\right) \cdot \left(1 - v15\_demand\_regr\left(iso, "processedshare"\right)\right) \cdot v15\_demand\_regr\left(iso, "vegfruitshare"\right) \end{multline*}\]
\[\begin{multline*} v15\_kcal\_regr(iso,kfo\_st) = v15\_kcal\_regr\_total(iso) \cdot \left(1 - v15\_demand\_regr\left(iso, "livestockshare"\right)\right) \cdot \left(1 - v15\_demand\_regr\left(iso, "processedshare"\right)\right) \cdot \left(1 - v15\_demand\_regr\left(iso, "vegfruitshare"\right)\right) \cdot \sum_{ct}i15\_staples\_kcal\_structure\_iso(ct,iso,kfo\_st) \end{multline*}\]
Within the major foodgroups determined by the regressions (animal calories, empty calories, fruits, vegetable and nut calories as well as staple calories), the relative share of individual products (e.g. eggss with animal calories) is assumed to be constant. An exception is the demand for ruminant meat, which declines in the course of the century at the cost of chicken meat.
The calculations are exectued in the following order:
In the beginning of each time step, the body height is estimated based on the diets of the previous 15 years. In case that the time step length exceed 5 years, the consumption is extrapolated using the last two time steps. Body height is estimated using the consumption of proteins and fats, in our case the foodgroups animal products, pulses and oils. To estimate the body size of underaged (0-14 years), we scale the WHO body height recommendations for underaged with the divergence of the 15-19 year olds. The body height estimates are repeated again at the end of the time step to improve the results of the extrapolation for cases where the time step length exceeds 5 years.
p15_bodyweight(t,iso,sex,age,bmi_group15)= f15_bmi(sex,age,bmi_group15) * (p15_bodyheight(t,iso,sex,age,"preliminary")/100)**2;Physical activity levels (PAL) relative to the basic metabolic rate (BMR) are estimated based on physical inactivity levels, assuming PALs for sedentary and medium-active populations of 1.53 and 1.76 respectively.
p15_physical_activity_level(t,iso,sex,age)=
                            im_physical_inactivity(t,iso,sex,age) * 1.53
                            +(1-im_physical_inactivity(t,iso,sex,age)) * 1.76
                            ;
i15_intake(t,iso,sex,age,bmi_group15)=
                        (f15_schofield(sex,age, "intercept")
                        + f15_schofield(sex,age, "slope")*p15_bodyweight(t,iso,sex,age,bmi_group15))
                        * p15_physical_activity_level(t,iso,sex,age);
Then, the divergence of the BMI from the regression during the historical period is estimated for calibration purposes.
if (sum(sameas(t_past,t),1) = 1,
   i15_bmi_shr_regr_pre(t,iso,sex,agegroup15,bmi_tree15)  =
   f15_bmi_shr_paras(sex,agegroup15,bmi_tree15,"intercept")
   + (f15_bmi_shr_paras(sex,agegroup15,bmi_tree15,"saturation") * im_gdp_pc_ppp_iso(t,iso))
   / (f15_bmi_shr_paras(sex,agegroup15,bmi_tree15,"halfsaturation") + im_gdp_pc_ppp_iso(t,iso));
   i15_bmi_shr_pre(t,iso,sex,agegroup15,"verylow")   =
      i15_bmi_shr_regr_pre(t,iso,sex,agegroup15,"low")*
      i15_bmi_shr_regr_pre(t,iso,sex,agegroup15,"lowsplit");
   i15_bmi_shr_pre(t,iso,sex,agegroup15,"low")   =
      i15_bmi_shr_regr_pre(t,iso,sex,agegroup15,"low")*
      (1-i15_bmi_shr_regr_pre(t,iso,sex,agegroup15,"lowsplit"));
   i15_bmi_shr_pre(t,iso,sex,agegroup15,"medium")   =
      (1-i15_bmi_shr_regr_pre(t,iso,sex,agegroup15,"low")
      -i15_bmi_shr_regr_pre(t,iso,sex,agegroup15,"high"))*
      (1-i15_bmi_shr_regr_pre(t,iso,sex,agegroup15,"mediumsplit"));
   i15_bmi_shr_pre(t,iso,sex,agegroup15,"mediumhigh")   =
      (1-i15_bmi_shr_regr_pre(t,iso,sex,agegroup15,"low")
      -i15_bmi_shr_regr_pre(t,iso,sex,agegroup15,"high"))*
      i15_bmi_shr_regr_pre(t,iso,sex,agegroup15,"mediumsplit");
   i15_bmi_shr_pre(t,iso,sex,agegroup15,"high")   =
      i15_bmi_shr_regr_pre(t,iso,sex,agegroup15,"high")*
      (1-i15_bmi_shr_regr_pre(t,iso,sex,agegroup15,"highsplit"));
   i15_bmi_shr_pre(t,iso,sex,agegroup15,"veryhigh")   =
      i15_bmi_shr_regr_pre(t,iso,sex,agegroup15,"high")*
      i15_bmi_shr_regr_pre(t,iso,sex,agegroup15,"highsplit");
   i15_bmi_shr_calib(t,iso,sex,age,bmi_group15)   =
   f15_bmi_shr_past(t,iso,age,sex,bmi_group15) -
   sum(agegroup2age(agegroup15,age),
       i15_bmi_shr_pre(t,iso,sex,agegroup15,bmi_group15)
   );
   i15_bmi_shr_calib_lastcalibyear(iso,sex,age,bmi_group15)=i15_bmi_shr_calib(t,iso,sex,age,bmi_group15);
else
The divergence of the BMI from the historical data is kept constant over time or fades out.
   i15_bmi_shr_calib(t,iso,sex,age,bmi_group15) =
   i15_bmi_shr_calib_lastcalibyear(iso,sex,age,bmi_group15)
   * f15_kcal_calib_fadeout(t,"%c15_calibscen%");
);
Pregnancy and lactation requires additonal food intakes. To account for this, newborns are distributed among reproductive women in a population. This number is then multiplied with the extra energy requirements
i15_kcal_pregnancy(t,iso)=sum(sex,im_demography(t,iso,sex,"0--4")/5) * ((40/66)*845 + (26/66)*675);Before MAgPIE is executed, the food demand model is executed, at first without price shocks.
Food demand and BMIs are calibrated so that historical food demand is met. For this purpose, the residual between the regression fit and the observation is calculated for the historical period. When the historical period ends, the calibarion factor is fixed at the value of the last period. Additionally, a second calibration is requrired to meet the FAOSTAT fooduse demand. While the food demand model estimates the demand for all countries of the world, FAOSTAT only has a subset of countries. To match FAOSTAT totals, the food demand of these countries is calibrated to zero. As this calibration is done ex-post, food demand estimates can still be used for all countries, but MAgPIE only considers demand from FAOSTAT countries.
if (sum(sameas(t_past,t),1) = 1,
    p15_kcal_calib(t,iso,kfo)$(sum(kfo2,f15_kcal_pc_iso(t,iso,kfo2))=0) = 0;
    p15_balanceflow_kcal_iso(t,iso,kfo)$(sum(kfo2,f15_kcal_pc_iso(t,iso,kfo2))>0) = 0;
    p15_kcal_calib(t,iso,kfo)$(sum(kfo2,f15_kcal_pc_iso(t,iso,kfo2))>0) = f15_kcal_pc_iso(t,iso,kfo) - v15_kcal_regr.l(iso, kfo);
    p15_balanceflow_kcal_iso(t,iso,kfo)$(sum(kfo2,f15_kcal_pc_iso(t,iso,kfo2))=0) = f15_kcal_pc_iso(t,iso,kfo) - v15_kcal_regr.l(iso, kfo);
    p15_kcal_calib_lastcalibyear(iso,kfo) = p15_kcal_calib(t,iso,kfo);
    p15_balanceflow_kcal_lastcalibyear(iso,kfo) = p15_balanceflow_kcal_iso(t,iso,kfo);
    i15_bmi_shr_calib(t,iso,sex,age,bmi_group15) =
                      f15_bmi_shr_past(t,iso,age,sex,bmi_group15) -
                      v15_bmi_shr_regr.l(iso,sex,age,bmi_group15);
    i15_bmi_shr_calib_lastcalibyear(iso,sex,age,bmi_group15)=
                      i15_bmi_shr_calib(t,iso,sex,age,bmi_group15);
else
Depending on the scenario switch c15_calibscen, the divergence of the demand from the historical data is kept constant or eventually faded out
p15_kcal_calib(t,iso,kfo) = p15_kcal_calib_lastcalibyear(iso,kfo) * f15_kcal_calib_fadeout(t,"%c15_calibscen%");The divergence of the kcal of countries with no FAOSTAT data is kept constant over time.
p15_balanceflow_kcal_iso(t,iso,kfo) = p15_balanceflow_kcal_lastcalibyear(iso,kfo);Depending on the scenario switch c15_calibscen, the divergence of the BMI from the historical data is kept constant over time or fadet out.
   i15_bmi_shr_calib(t,iso,sex,age,bmi_group15) =
                     i15_bmi_shr_calib_lastcalibyear(iso,sex,age,bmi_group15)
                     * f15_kcal_calib_fadeout(t,"%c15_calibscen%");
);
The calibration factor is added to the regression value.
   p15_kcal_pc_iso(t,iso,kfo) =
          v15_kcal_regr.l(iso,kfo) + p15_kcal_calib(t,iso,kfo) * s15_calibrate;
Negative values that can possibly occur due to calibration, are set to zero.
p15_kcal_pc_iso(t,iso,kfo)$(p15_kcal_pc_iso(t,iso,kfo)<0) = 0;The country-level parameter p15_kcal_pc_iso is aggregated to regional level into the parameter p15_kcal_pc. This parameter is provided to constraint q15_food_demand in the MAgPIE model, which defines the demand for food.
Now, MAgPIE is executed.
After one time step of MAgPIE is executed, the shadow prices of the food demand constraint are fed back into the food demand module, and the food demand module is executed once again.
If s15_elastic_demand is 0, MAgPIE is not executed again for this time step. In case that s15_elastic_demand is 1, it is checked whether MAgPIE and the food demand model have reached sufficient convergence. The criterion for this is whether the real income in the food demand model has changed in any country by more than s15_convergences_measure relative to the last iteration due to changes in food prices from MAgPIE. Moreover, the model aborts when the number of iterations reaches s15_maxiter. As long as the iteration continues, the food prices are transferred from MAgPIE to the food demand model, and the food demand is transferred from the food demand model to MAgPIE.
After each execution of the food demand model, the body height distribution of the population is estimated. The starting point is the body height distribution of the last timestep. The body height estimates of the old period are moved into the subsequent age class (e.g. the 20-24 year old are now 25-29 years old). The age class of 15-19 year olds is estimated newly using the body height regressions and the food consumption of the last 15 years.
   p15_bodyheight(t,iso,"F","15--19","final") =
                     126.4*
                     (sum(underaged15,
                       p15_kcal_growth_food(t,iso,underaged15)
                     )/3)**0.03464
                     ;
   p15_bodyheight(t,iso,"M","15--19","final") =
                     131.8*
                     (sum(underaged15,
                       p15_kcal_growth_food(t,iso,underaged15)
                     )/3)**0.03975
                     ;
The bodyheight of the underaged age class (0-14) is assumed to diverge from ‘normal’ body height by the same proportion as age class of the 15-19 year olds. This rotation is repeated for the 5-year length of the time step, it is repeated 3 times.
p15_bodyheight(t,iso,"M","0--4","final")=p15_bodyheight(t,iso,"M","15--19","final")/176*92;
p15_bodyheight(t,iso,"M","5--9","final")=p15_bodyheight(t,iso,"M","15--19","final")/176*125;
p15_bodyheight(t,iso,"M","10--14","final")=p15_bodyheight(t,iso,"M","15--19","final")/176*152;
p15_bodyheight(t,iso,"F","0--4","final")=p15_bodyheight(t,iso,"M","15--19","final")/163*91;
p15_bodyheight(t,iso,"F","5--9","final")=p15_bodyheight(t,iso,"M","15--19","final")/163*124;
p15_bodyheight(t,iso,"F","10--14","final")=p15_bodyheight(t,iso,"M","15--19","final")/163*154;
Finally, the regression outcome is calibrated by a country-specific additive term, which is the residual of the regression fit and observation of the last historical time step
if (sum(sameas(t_past,t),1) = 1,
  p15_bodyheight_calib(t,iso,sex,age_new_estimated15) = f15_bodyheight(t,iso,sex,age_new_estimated15) - p15_bodyheight(t,iso,sex,age_new_estimated15,"final");
  p15_bodyheight(t,iso,sex,age_new_estimated15,"final") = f15_bodyheight(t,iso,sex,age_new_estimated15);
else
  p15_bodyheight_calib(t,iso,sex,age_new_estimated15)=p15_bodyheight_calib(t-1,iso,sex,age_new_estimated15);
  p15_bodyheight(t,iso,sex,age_new_estimated15,"final")=p15_bodyheight(t,iso,sex,age_new_estimated15,"final")+p15_bodyheight_calib(t,iso,sex,age_new_estimated15)*s15_calibrate;
);
Limitations There are no known limitations.
| Description | Unit | A | |
|---|---|---|---|
| f15_bmi (sex, age, bmi_group15) |
Mean body mass index for each BMI group | \(kg/m2\) | x |
| f15_bmi_shr_paras (sex, agegroup15, bmi_tree15, paras_b15) |
BMI share regression parameters in USD05PPP or dimensionless | \(X\) | x |
| f15_bmi_shr_past (t_all, iso, age, sex, bmi_group15) |
Mean body mass index for each BMI group | \(kg/m2\) | x |
| f15_bodyheight (t_all, iso, sex, age) |
Body height | \(cm/cap\) | x |
| f15_demand_paras (regr15, food_scen15, par15) |
Food regression parameters in USD05PPP or dimensionless | \(X\) | x |
| f15_household_balanceflow (t_all, i, kall, dm_ge_nr) |
Balance flow to take account of heterogeneous products and processes | \(10^6 tDM\) | x |
| f15_intake_pc_observed_iso (t_all, iso, sex, age) |
Observed per capita calorie intake in the past | \(kcal/captia/day\) | x |
| f15_kcal_calib_fadeout (t_all, calibscen15) |
Calibration fadeout factor | \(1\) | x |
| f15_kcal_pc_iso (t_all, iso, kfo) |
Observed per capita calories in the past | \(kcal/cap/day\) | x |
| f15_nutrition_attributes (t_all, kall, nutrition) |
Nutrition attributes of food items dedicated for fooduse | \(10^6 kcal/tDM | t Protein/tDM\) | x |
| f15_price_index (t_all) |
Food price index in initialization period | \(USD_{05MER}/t DM\) | x |
| f15_prices_initial (kall) |
Food prices in initialization period | \(USD_{05MER}/t DM\) | x |
| f15_ruminant_fadeout (t_all, ruminantfadeoutscen15) |
Ruminant fadeout scenario | \(1\) | x |
| f15_schofield (sex, age, paras_s15) |
Schofield equation parameters in kcal per capita per day or kcal per capita per day per weight | \(X\) | x |
| i15_bmi_halfsat (sex, agegroup15, bmi_tree15) |
BMI share regression halfsaturation | \(1\) | x |
| i15_bmi_intercept (sex, agegroup15, bmi_tree15) |
BMI share regression intercept | \(1\) | x |
| i15_bmi_saturation (sex, agegroup15, bmi_tree15) |
BMI share regression saturation | \(1\) | x |
| i15_bmi_shr_calib (t, iso, sex, age, bmi_group15) |
Calibration parameters to meet historical BMI shares | \(1\) | x |
| i15_bmi_shr_calib_lastcalibyear (iso, sex, age, bmi_group15) |
Calibration parameters of the last year with historical observations | \(1\) | x |
| i15_bmi_shr_pre (t, iso, sex, agegroup15, bmi_group15) |
BMI share precalculation based on regression parameters required for calibration | \(1\) | x |
| i15_bmi_shr_regr_pre (t, iso, sex, agegroup15, bmi_tree15) |
BMI regression share precalculation based on regression parameters required for calibration | \(1\) | x |
| i15_dem_halfsat (regr15) |
Food regression parameters halfsaturation | \(USD_{05PPP}/cap\) | x |
| i15_dem_intercept (regr15) |
Food regression parameters intercept in kcal or as share | \(X\) | x |
| i15_dem_nonsat (regr15) |
Food regression parameters nonsaturation | \(1\) | x |
| i15_dem_saturation (regr15) |
Food regression parameters saturation in kcal or as share | \(X\) | x |
| i15_intake (t, iso, sex, age, bmi_group15) |
Mean food intake by population group | \(kcal/capita/day\) | x |
| i15_kcal_pregnancy (t, iso) |
Additional calorie requriements for pregnancy and lactation | \(kcal\) | x |
| i15_livestock_kcal_iso_tmp (t, iso) |
Intermediate calculation do not use elsewhere | \(kcal/cap/day\) | x |
| i15_livestock_kcal_structure_iso (t, iso, kfo_ap) |
Share of livestock products within total staples (corrected for future changes in shares) | \(1\) | x |
| i15_livestock_kcal_structure_iso_raw (t, iso, kfo_ap) |
Share of a livestock products within total staples (uncorrected for future changes in shares) | \(1\) | x |
| i15_prices_initial_kcal (iso, kfo) |
Initial prices that capture the approximate level of prices in 1961-2010 | \(USD_{05PPP}/kcal\) | x |
| i15_processed_kcal_structure_iso | Share of a processed product within total staples | \(1\) | x |
| i15_ruminant_fadeout (t_all) |
ruminant fadeout share | \(1\) | x |
| i15_staples_kcal_iso_tmp (t, iso) |
Intermediate calculation do not use elsewhere | \(kcal/cap/day\) | x |
| i15_staples_kcal_structure_iso (t, iso, kfo_st) |
Share of a staple products within total staples | \(1\) | x |
| o15_kcal_regr_initial (iso, kfo) |
Uncalibrated per capita demand before price shock | \(kcal/capita/day\) | x |
| p15_balanceflow_kcal (t, i, kfo) |
Balance flow for mismatch between FAOSTAT and demand estimates | \(kcal/capita/day\) | x |
| p15_balanceflow_kcal_iso (t, iso, kfo) |
Balance flow for mismatch between FAOSTAT and demand estimates | \(kcal/capita/day\) | x |
| p15_balanceflow_kcal_lastcalibyear (iso, kfo) |
Balance flow of last historic time step for mismatch between FAOSTAT and demand estimates | \(kcal/capita/day\) | x |
| p15_bmi_shr (t, iso, sex, age, bmi_group15) |
Calibrated estimates BMI share for population groups | \(1\) | x |
| p15_bodyheight (t, iso, sex, age, estimates15) |
Body height | \(cm/cap\) | x |
| p15_bodyheight_calib (t, iso, sex, age_new_estimated15) |
Calibration factor for regional height differences | \(cm\) | x |
| p15_bodyweight (t, iso, sex, age, bmi_group15) |
Body weight | \(kg/cap\) | x |
| p15_convergence_measure (t) |
Convergence measure to decide for continuation or stop of food_demand - magpie iteration | \(1\) | x |
| p15_delta_income (t, i) |
Regional change in per capita income due to price shock on regional level | \(1\) | x |
| p15_income_pc_real_ppp (t, i) |
Regional per capita income after price shock on regional level | \(USD_{05PPP}/capita\) | x |
| p15_iteration_counter (t) |
Number of iterations required for reaching an equilibrium between food demand model and magpie | \(1\) | x |
| p15_kcal_calib (t, iso, kfo) |
Balance flow to diverge from mean calories of regressions | \(kcal/cap/day\) | x |
| p15_kcal_calib_lastcalibyear (iso, kfo) |
Calibration factor for the last year with observations | \(kcal/cap/day\) | x |
| p15_kcal_growth_food (t_all, iso, underaged15) |
Average per capita demand for body size growth relevant food items in the last three 5-year steps | \(kcal/capita/day\) | x |
| p15_kcal_intake_total (t, iso) |
Total food intake in a country | \(kcal/capita/day\) | x |
| p15_kcal_pc (t, i, kfo) |
Per capita consumption in food demand model after price shock on regional level | \(kcal/capita/day\) | x |
| p15_kcal_pc_calibrated (t, i, kfo) |
Calibrated per capita consumption in food demand model after price shock | \(kcal/capita/day\) | x |
| p15_kcal_pc_initial (t, i, kfo) |
Per capita consumption in food demand model before price shock on regional level | \(kcal/capita/day\) | x |
| p15_kcal_pc_initial_iso (t, iso, kfo) |
Per capita consumption in food demand model before price shock on country level | \(kcal/capita/day\) | x |
| p15_kcal_pc_iso (t, iso, kfo) |
Per capita consumption in food demand model after price shock on country level | \(kcal/capita/day\) | x |
| p15_kcal_regr (t, iso, kfo) |
Uncalibrated regression estimates of calorie demand | \(kcal/cap/day\) | x |
| p15_lastiteration_delta_income (i) |
Regional change in per capita income due to price shock of last iteration | \(1\) | x |
| p15_modelstat (t) |
Model solver status | \(1\) | x |
| p15_physical_activity_level (t, iso, sex, age) |
Physical activity levels in PAL relative to basic metabolic rate BMR | \(kcal/kcal\) | x |
| p15_prices_kcal (t, iso, kfo) |
Prices from MAgPIE after optimization | \(USD_{05PPP}/kcal\) | x |
| q15_aim | Objective function of food demand model | \(10^6 USD_{05PPP}\) | x |
| q15_bmi_shr_agg (iso, sex, age, bmi_group15) |
Disaggregates age groups from overarching groups | \(1\) | x |
| q15_bmi_shr_high (iso, sex, agegroup15) |
Estimates BMI share for population groups with high BMI | \(1\) | x |
| q15_bmi_shr_low (iso, sex, agegroup15) |
Estimates BMI share for population groups with very low BMI | \(1\) | x |
| q15_bmi_shr_medium (iso, sex, agegroup15) |
Estimates BMI share for population groups with medium BMI(1) | x | |
| q15_bmi_shr_medium_high (iso, sex, agegroup15) |
Estimates BMI share for population groups with medium to high BMI | \(1\) | x |
| q15_bmi_shr_veryhigh (iso, sex, agegroup15) |
Estimates BMI share for population groups with very high BMI | \(1\) | x |
| q15_bmi_shr_verylow (iso, sex, agegroup15) |
Estimates BMI share for population groups with low BMI | \(1\) | x |
| q15_budget (iso) |
Household budget constraint | \(USD_{05PPP}/cap/day\) | x |
| q15_food_demand (i, kfo) |
Food demand | \(10^6 kcal\) | x |
| q15_foodtree_kcal_animals (iso, kfo_ap) |
Demand for animal products | \(kcal/cap/day\) | x |
| q15_foodtree_kcal_processed (iso, kfo_pf) |
Demand for processed products | \(kcal/cap/day\) | x |
| q15_foodtree_kcal_staples (iso, kfo_st) |
Demand for staple products | \(kcal/cap/day\) | x |
| q15_foodtree_kcal_vegetables (iso) |
Demand for vegetable and fruit products | \(kcal/cap/day\) | x |
| q15_intake (iso) |
Estimates average intake for the entire country | \(kcal/cap/day\) | x |
| q15_regr (iso, regr15) |
Estimates parameters for food demand and dietary composition | \(1\) | x |
| q15_regr_bmi_shr (iso, sex, agegroup15, bmi_tree15) |
Estimates regression parameters for BMI regression shares | \(1\) | x |
| q15_regr_kcal (iso) |
Per capita total demand | \(kcal/cap/day\) | x |
| s15_calibrate | Calibration switch (1=calibrated 2=pure regresssion outcomes) | \(1\) | x |
| s15_convergence | Convergence criterion | \(1\) | x |
| s15_count | Loop counter for interpolating body height estimates between longer timesteps | \(1\) | x |
| s15_elastic_demand | elastic demand switch (1=elastic 0=exogenous) | \(1\) | x |
| s15_maxiter | Scalar defining maximum number of iterations | \(1\) | x |
| s15_year | Current year as integer value | \(yr\) | x |
| v15_bmi_shr_overgroups (iso, sex, agegroup15, bmi_group15) |
Uncalibrated share of population groups belonging to a certain BMI group | \(1\) | x |
| v15_bmi_shr_regr (iso, sex, age, bmi_group15) |
Uncalibrated share of population groups belonging to a certain BMI group | \(1\) | x |
| v15_demand_regr (iso, regr15) |
Uncalibrated regression estimates of kcal shares | \(1\) | x |
| v15_income_balance (iso) |
Balance variable to balance cases in which reduction in income is larger than the per capita GDP | \(USD_{05PPP}/cap/yr\) | x |
| v15_income_pc_real_ppp_iso (iso) |
Real income per cap | \(USD_{05PPP}/cap\) | x |
| v15_kcal_intake_total_regr (iso) |
Food intake | \(kcal/cap/day\) | x |
| v15_kcal_regr (iso, kfo) |
Uncalibrated regression estimates of calorie demand | \(kcal/cap/day\) | x |
| v15_kcal_regr_total (iso) |
Uncalibrated regression estimates of total per cap calories | \(kcal/cap/day\) | x |
| v15_objective | Objective term | \(USD_{05PPP}\) | x |
| v15_regr_overgroups (iso, sex, agegroup15, bmi_tree15) |
Hierarchical tree parameter regressions | \(1\) | x |
| description | |
|---|---|
| adult15(age) | Age groups for adult population |
| age | Population age groups |
| age_new_estimated15(age) | Estimated ages |
| age2_adults15(agegroup15) | Adult age group |
| agegroup15 | All age groups |
| agegroup2age(agegroup15, age) | Mapping between age cohort and age |
| attributes | Product attributes characterizing a product (such as weight or energy content) |
| bmi_group_est15(bmi_group15) | Body mass index extremes |
| bmi_group15 | Body mass index gradient |
| bmi_tree15 | Body mass index |
| calibscen15 | Calibration scenarios for balance flow |
| ct(t) | Current time period |
| dm_ge_nr(nutrients) | Attribtues relevant for nutrition |
| estimates15 | Preliminary or final result for body height distribution |
| food_scen15 | Food scenarios |
| growth_food15(kfo) | Food items that are important for body growth regression |
| i | World regions |
| i_to_iso(i, iso) | Mapping between regions and countries |
| i2(i) | World regions (dynamic set) |
| iso | Countries |
| kall | All products in the sectoral version |
| kfo_ap(kfo) | Animal food products |
| kfo_pf(kfo) | Processed foods including oils sugar alcohol |
| kfo_st(kfo) | Staple products |
| kfo(kall) | All products in the sectoral version |
| knf(kall) | Non-food products in the sectoral version |
| kst(kfo) | Plant-based staple products in the sectoral version |
| nutrition | Nutritition attributes |
| par15 | Parameters for food module |
| paras_b15 | Intake equation parameters |
| paras_s15 | Schofield equation parameters |
| pop_scen15 | Population scenarios |
| regr15 | Demand regression types |
| reproductive(age) | Age group of people in the reproductive age |
| retired15(adult15) | Age group of retired population |
| ruminantfadeoutscen15 | Scenarios for changed composition of livestock products |
| sex | Sex groups |
| t_all | 5-year time periods |
| t_past(t_all) | Timesteps with observed data |
| t(t_all) | Simulated time periods |
| type | GAMS variable attribute used for the output |
| underaged15(age) | Group of underaged age classes |
| working15(adult15) | Group of working age population |
Benjamin Leon Bodirsky, Jan Philipp Dietrich
09_drivers, 16_demand, 20_processing, 62_material, 70_livestock
Bodirsky, Benjamin Leon, Jan Philipp Dietrich, Eleonora Martinelli, Anthonia Stenstad, Prajal Pradhan, Susanne Rolinski, Sabine Gabrysch, et al. n.d. “From Starved to Stuffed: Long-Term Dynamics of Diets and Anthropometrics.”