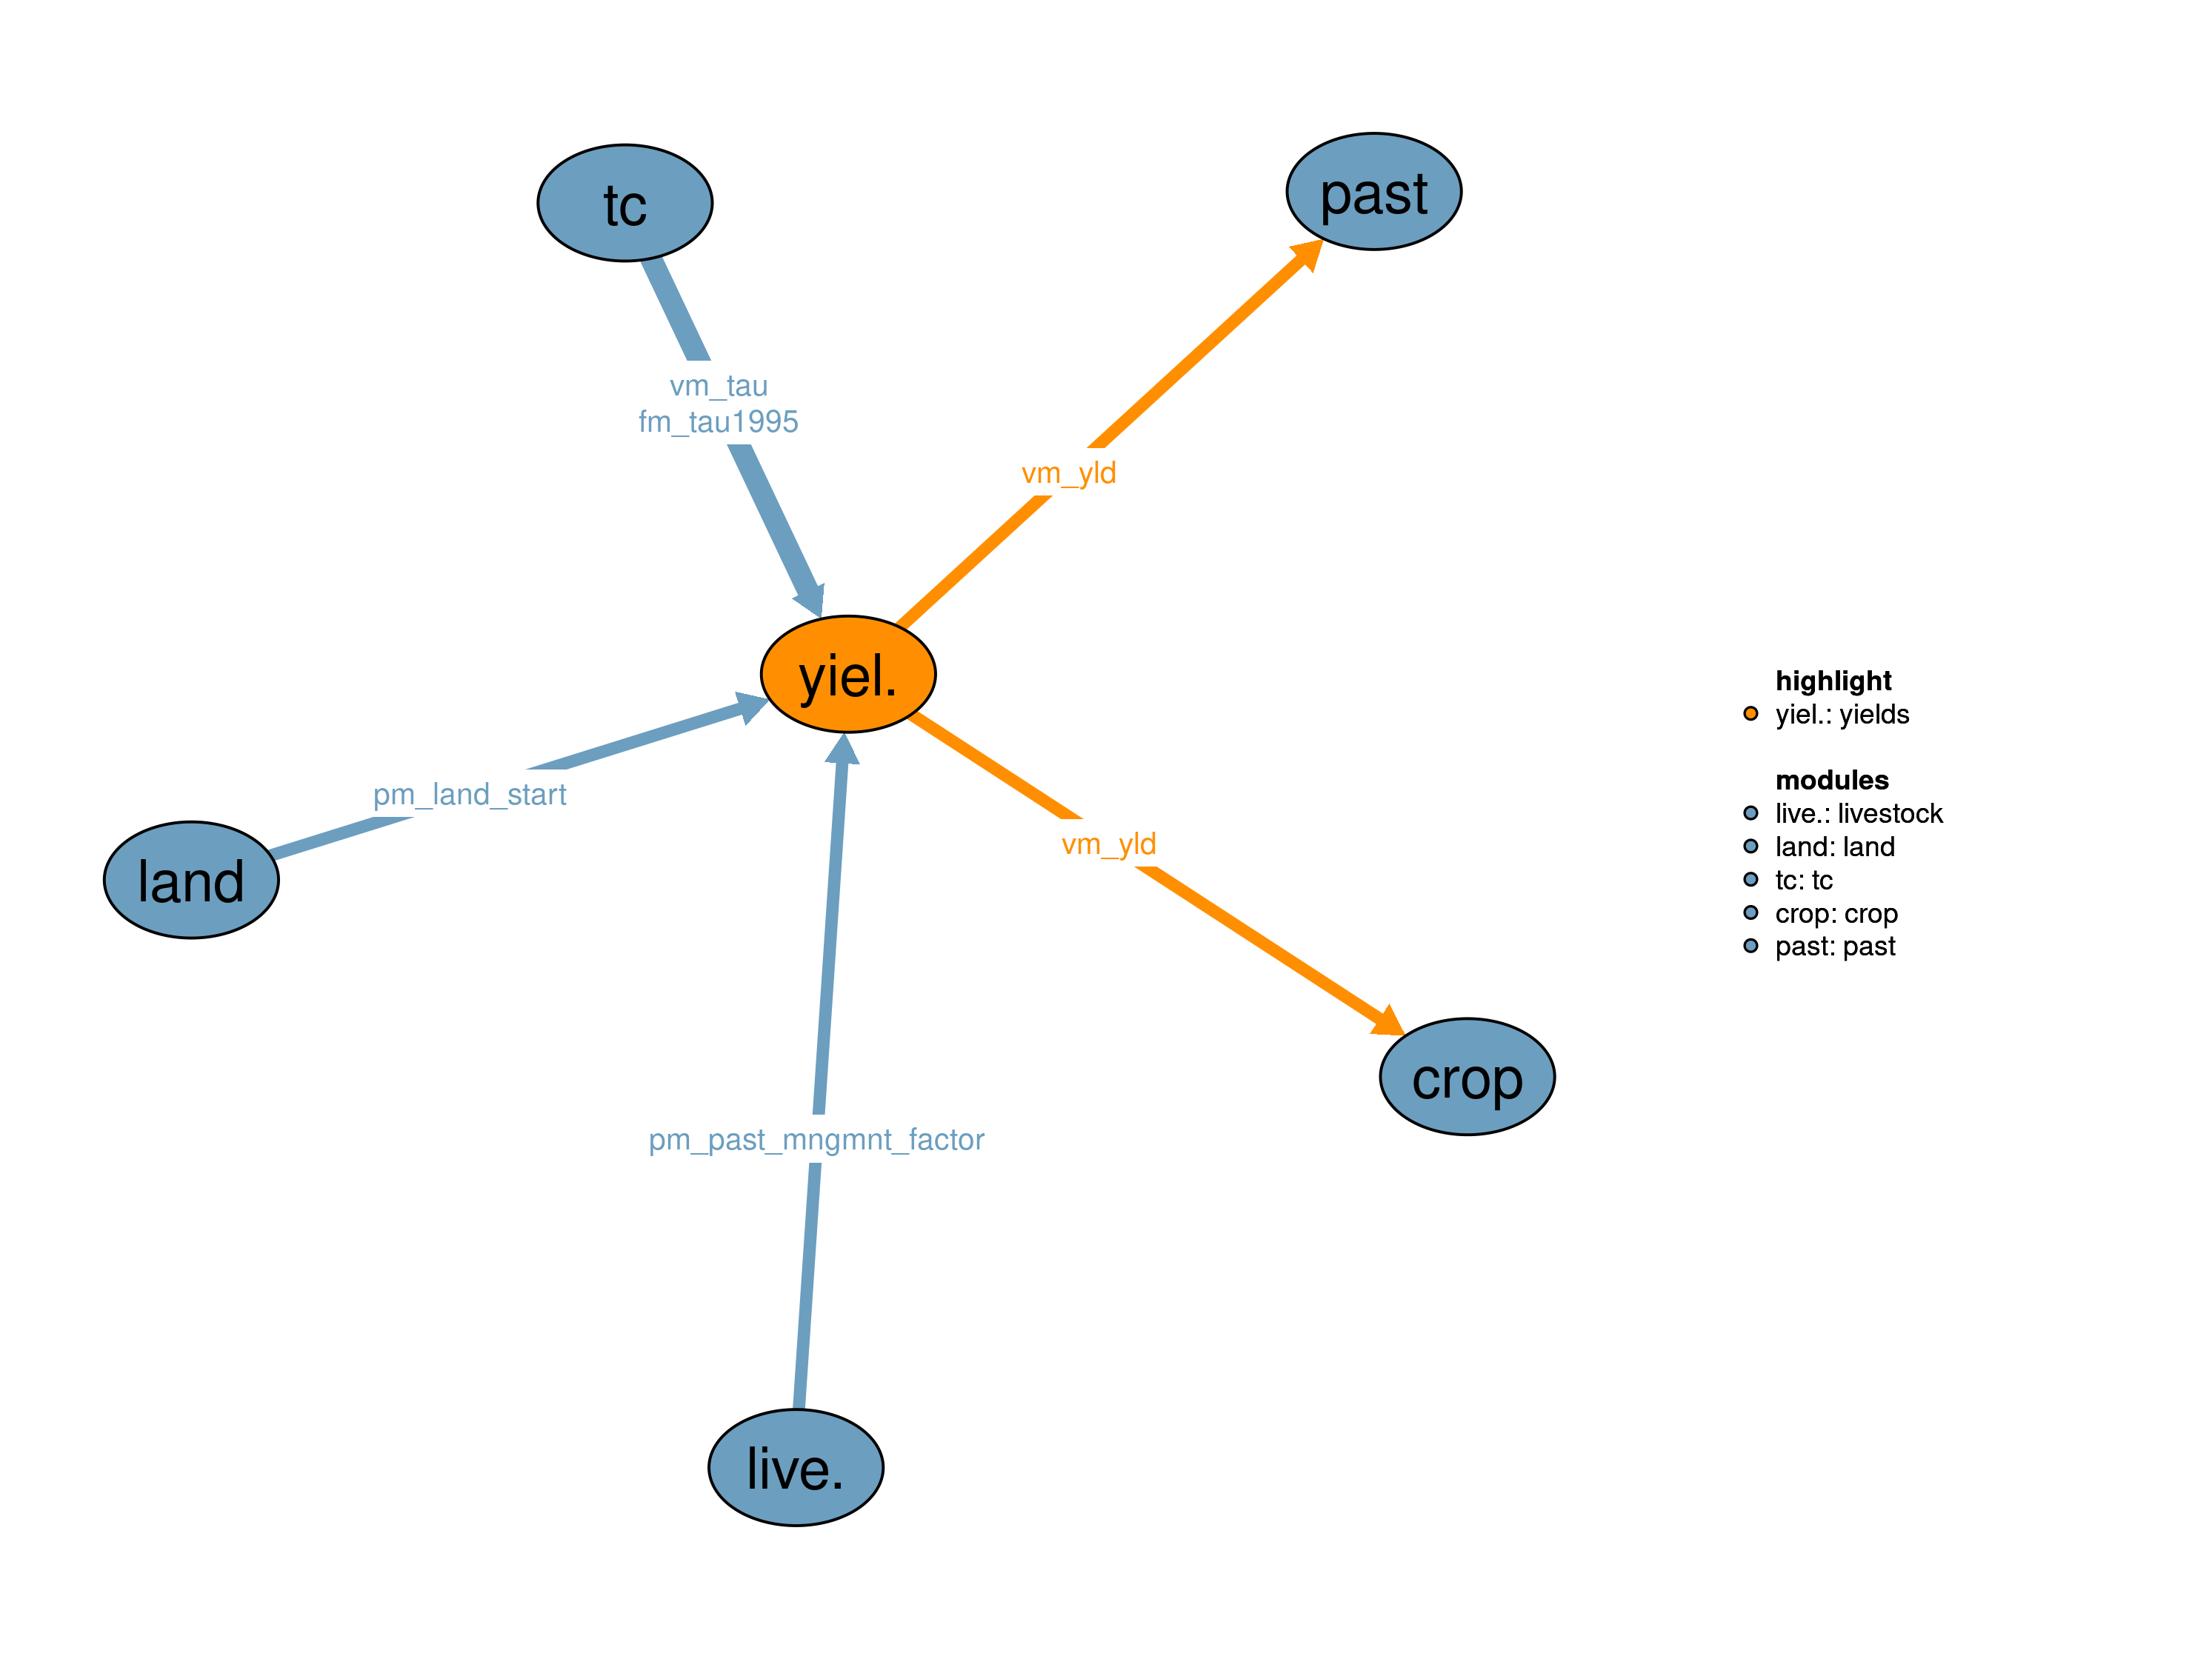
The yields module simulates the temporal development of crop yields and pasture productivity. Spatially explicit information on pasture productivity and crop yields under both rainfed and irrigated conditions is provided by the global gridded crop model LPJmL (Lund-Potsdam-Jena with managed Land) (Bondeau et al. 2007). In the initial year of the simulation period, crop yields and pasture productivity are calibrated at the regional level to meet the observed cropland and pasture area as reported by FAO (FAOSTAT 2016). For the simulation of the temporal development of agricultural yields, the module receives information about the agricultural land use intensity represented by the \(\tau\) factor coming from the module 13_tc.
The module returns yields for all crops and for pasture, which is then used by the modules 30_crop and 31_past.
| Description | Unit | A | B | |
|---|---|---|---|---|
| fm_tau1995 (i) |
Agricultural land use intensity tau in 1995 | \(1\) | x | x |
| pm_land_start (j, land) |
Land initialization area | \(10^6 ha\) | x | |
| pm_past_mngmnt_factor (t, i) |
Regional pasture management intensification factor | \(1\) | x | |
| vm_tau (i) |
Agricultural land use intensity tau | \(1\) | x | x |
| Description | Unit | |
|---|---|---|
| vm_yld (j, kve, w) |
Yields (variable because of technical change) | \(tDM/ha/yr\) |
The biocorrect realization reads in the LPJmL data and performs several corrections. First, a bioenergy yield correction is performed. As there is currently no robust information on bioenergy yields available in (FAOSTAT 2016), it is assumed that the LPJmL yields for bioenergy correspond to the yields achieved under the highest currently observed value of the \(\tau\) factor representing agricultural land use intensity. Bioenergy yields are downscaled proportionally to the respective \(\tau\) factor in the given region. Second, yields for all other crops are corrected on the regional level by applying a calibration factor that does not differentiate between crops. Pasture yields have their own regional calibration factors. Applied calibration factors are derived via comparing cropland and pasture areas in the initial time step with values reported by FAO (FAOSTAT 2016).
\[\begin{multline*} vm\_yld(j2,kcr,w) = \sum_{ct}i14\_yields(ct,j2,kcr,w) \cdot \sum_{cell(i2,j2)}\left(\frac{vm\_tau(i2)}{fm\_tau1995(i2)}\right) \end{multline*}\]
For the current time step of the optimization, cellular yields of irrigated and rainfed crops are calculated by multiplying calibrated input yields from LPJmL with the intensification rate relative to the initial time step 1995.
\[\begin{multline*} vm\_yld(j2,"pasture",w) = \sum_{ct}i14\_yields(ct,j2,"pasture",w) \cdot \left(1 + s14\_yld\_past\_switch \cdot \left(\sum_{cell(i2,j2)}\left(\frac{vm\_tau(i2)}{fm\_tau1995(i2)}\right) - 1\right)\right) \end{multline*}\]
In the case of pasture yields, technological change cannot be fully translated into yield increases. To account for that, the parameter s14_yld_past_switch is defined to capture a certain magnitude of spillovers that can range from 0 (no spillover) to 1 (full spillover).
Limitations The magnitude of spillover effects from technological change in the crop sector towards improvements in pasture management is very uncertain.
In the dynamic_aug18 realization, the crop yield calculations are identical as in the above described realization (biocorrect).
\[\begin{multline*} vm\_yld(j2,kcr,w) = \sum_{ct}i14\_yields(ct,j2,kcr,w) \cdot \sum_{cell(i2,j2)}\left(\frac{vm\_tau(i2)}{fm\_tau1995(i2)}\right) \end{multline*}\]
Pasture yields are not linked to yield increases in the crop sector, but to an exogenous pasture management factor pm_past_mngmnt_factor:
\[\begin{multline*} vm\_yld(j2,"pasture",w) = \sum_{ct}\left(i14\_yields(ct,j2,"pasture",w) \cdot \sum\left(cell(i2,j2),pm\_past\_mngmnt\_factor(ct,i2)\right)\right) \end{multline*}\]
Limitations The exogenous implementation of pasture intensification cannot capture feedbacks between land scarcity and efforts to improve pasture management.
| Description | Unit | A | B | |
|---|---|---|---|---|
| f14_pyld_hist (t_all, i) |
Modelled regional pasture yields in the past | \(tDM/ha/yr\) | x | |
| f14_yields (t_all, j, kve, w) |
LPJ potential yields per cell (rainfed and irrigated) | \(tDM/ha/yr\) | x | x |
| f14_yld_calib (i, ltype14) |
Calibration factor for the LPJ yields | \(1\) | x | x |
| i14_yields (t, j, kve, w) |
Biophysical input yields (excluding technological change) | \(tDM/ha/yr\) | x | x |
| p14_pyield_corr (t, i) |
Regional pasture management correction for historical time steps | \(1\) | x | |
| p14_pyield_LPJ_reg (t_all, i) |
Regional average input yields aggregated from clusters with initial pasture area as weights | \(tDM/ha/yr\) | x | |
| q14_yield_crop (j, kcr, w) |
Crop yields | \(tDM/ha/yr\) | x | x |
| q14_yield_past (j, w) |
Pasture yields | \(tDM/ha/yr\) | x | x |
| s14_yld_past_switch | Spillover parameter for translating technological change in the crop sector into pasture yield increases | \(1\) | x |
| description | |
|---|---|
| cell(i, j) | Mapping between regions i and clusters j |
| ct(t) | Current time period |
| i | World regions |
| i2(i) | World regions (dynamic set) |
| j | Spatial clusters |
| j2(j) | Spatial Clusters (dynamic set) |
| kcr(kve) | Cropping activities |
| kve(k) | Land-use activities |
| land | Land pools |
| ltype14 | calibration land types |
| t_all | 5-year time periods |
| t_past(t_all) | Timesteps with observed data |
| t(t_all) | Simulated time periods |
| type | GAMS variable attribute used for the output |
| w | Water supply type |
Jan Philipp Dietrich, Isabelle Weindl, Florian Humpenöder, Anne Biewald
10_land, 13_tc, 30_crop, 31_past, 70_livestock
Bondeau, Alberte, Pascalle C. Smith, Sönke Zaehle And Sibyll Schaphoff, Wolfgang Lucht, Wolfgang Cramer, Dieter Gerten, Hermann Lotze-Campen, Christoph Müller, Markus Reichstein, and Benjamin Smith. 2007. “Modelling the Role of Agriculture for the 20th Century Global Terrestrial Carbon Balance.” Global Change Biology 13 (3): 679–706. https://doi.org/10.1111/j.1365-2486.2006.01305.x.
FAOSTAT. 2016. “FAOSTAT Database.” Rome: The Food; Agriculture Organization of the United Nations (FAO). http://www.fao.org/faostat/en/.